

Hi,
The Arizona monsoon season still has my observing opportunities shut down for the time being, so I did what any sane observer would do. I bought more gear. In this case...I added R and I filters to the B and V that I already possess. All four filters are from Baader's Bessel conforming line of filters. A friend and fellow observer offered to test the bandpass on each filter using the spectrophotometer in the laboratory where he works. I took him the filters to be tested a few days ago. I've seen some discussion on other forum posts about bandpasses and finding conforming filters for photometry in today's market. I thought that posting those results here might contribute something useful to the discussion.
I don't claim to be an expert. I barely claim to be a novice. But the test results (posted below) seem pretty good to me. I'd be happy to hear feedback from more accomplished photometrists than I. The test results matched up very well with the bandpass data posted by Baader on their website - a comparison is shown below.
First, here are the test results, tested on this model of spectrophotometer
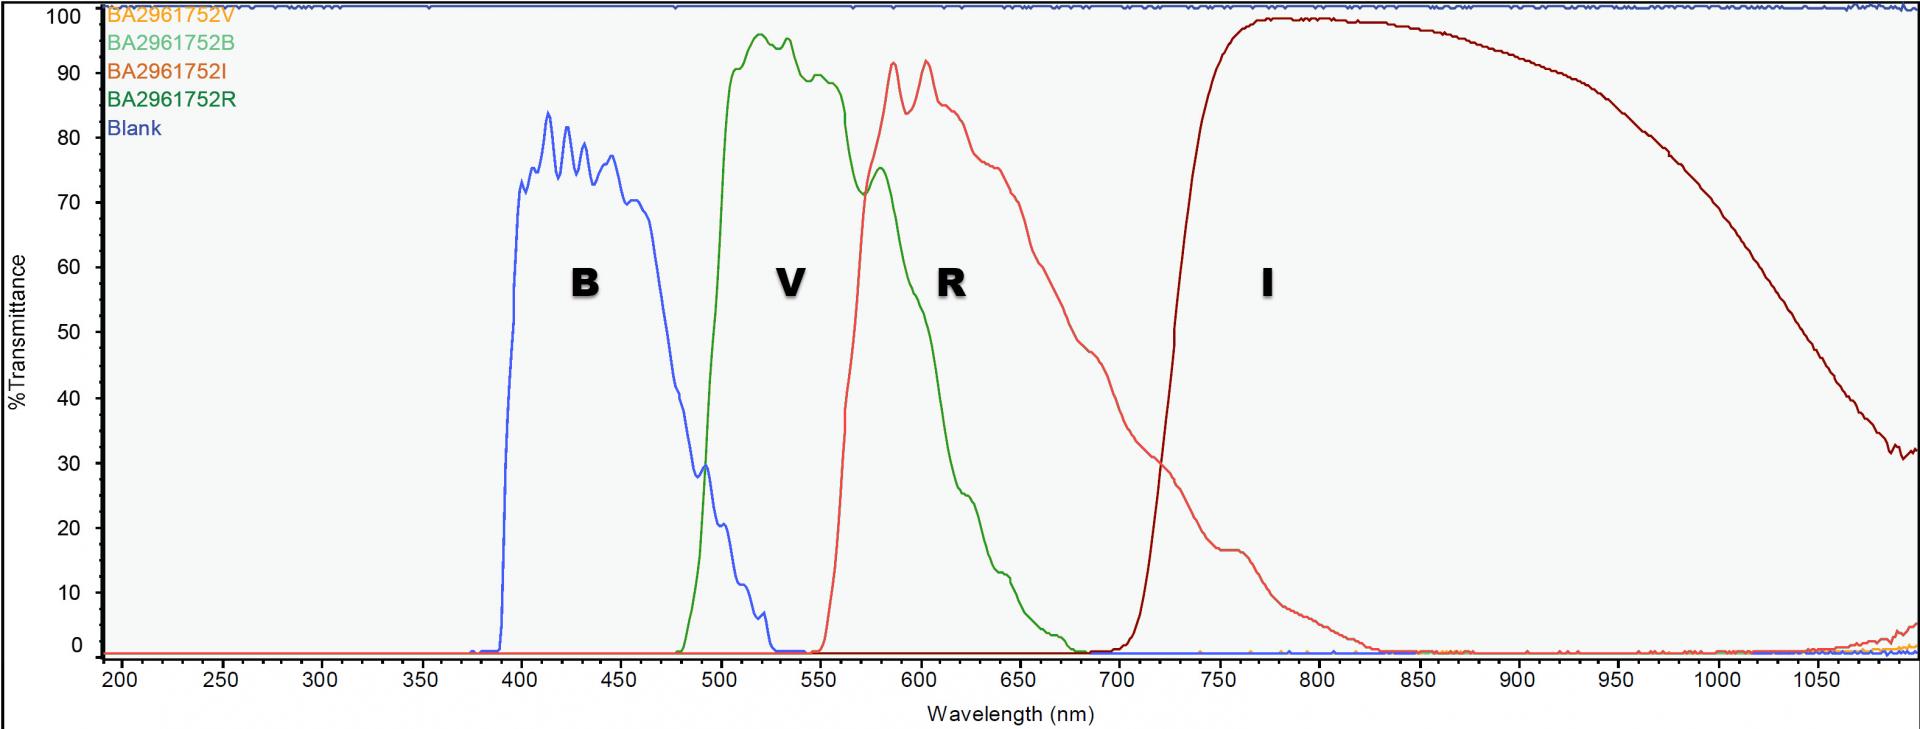
Next, the same test results overlaid on a chart of the Johnson/Cousins bandpasses - taken from this paper by Michael Bessell
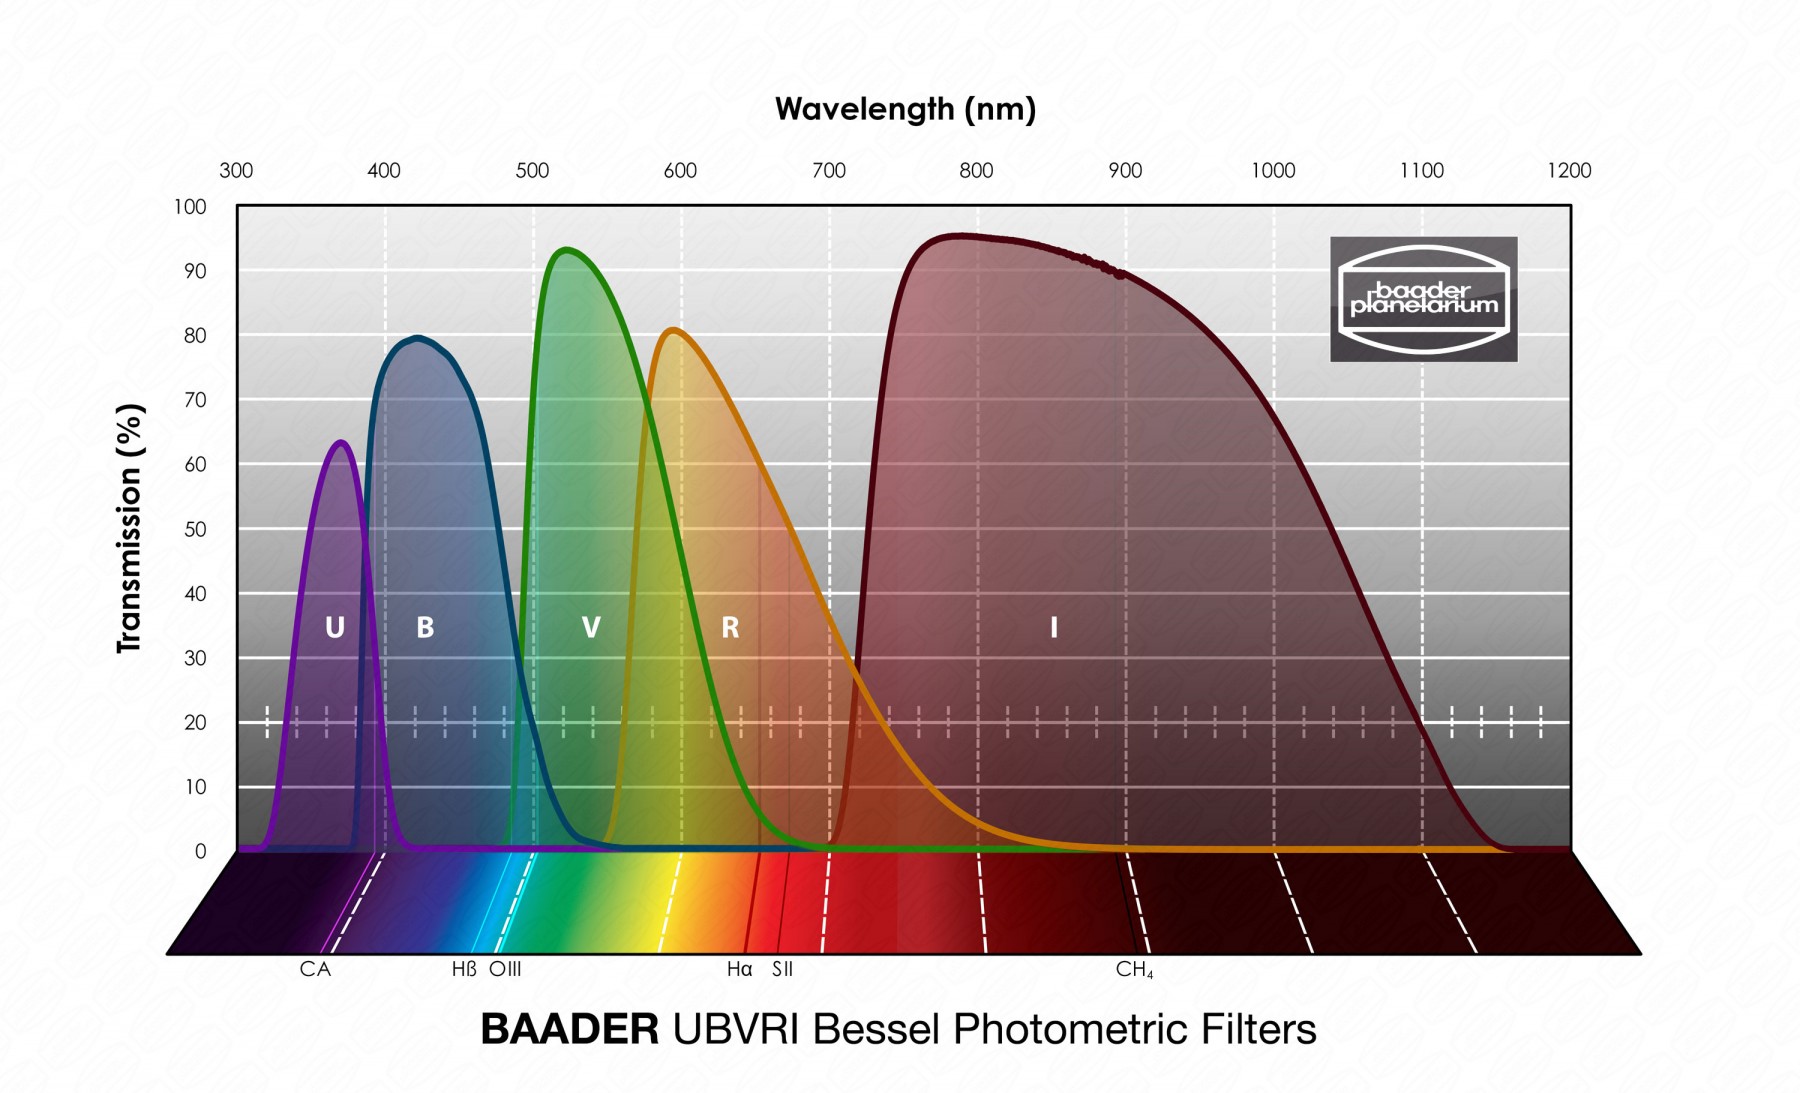
Finally, the test results compared to Baader's chart on their website.
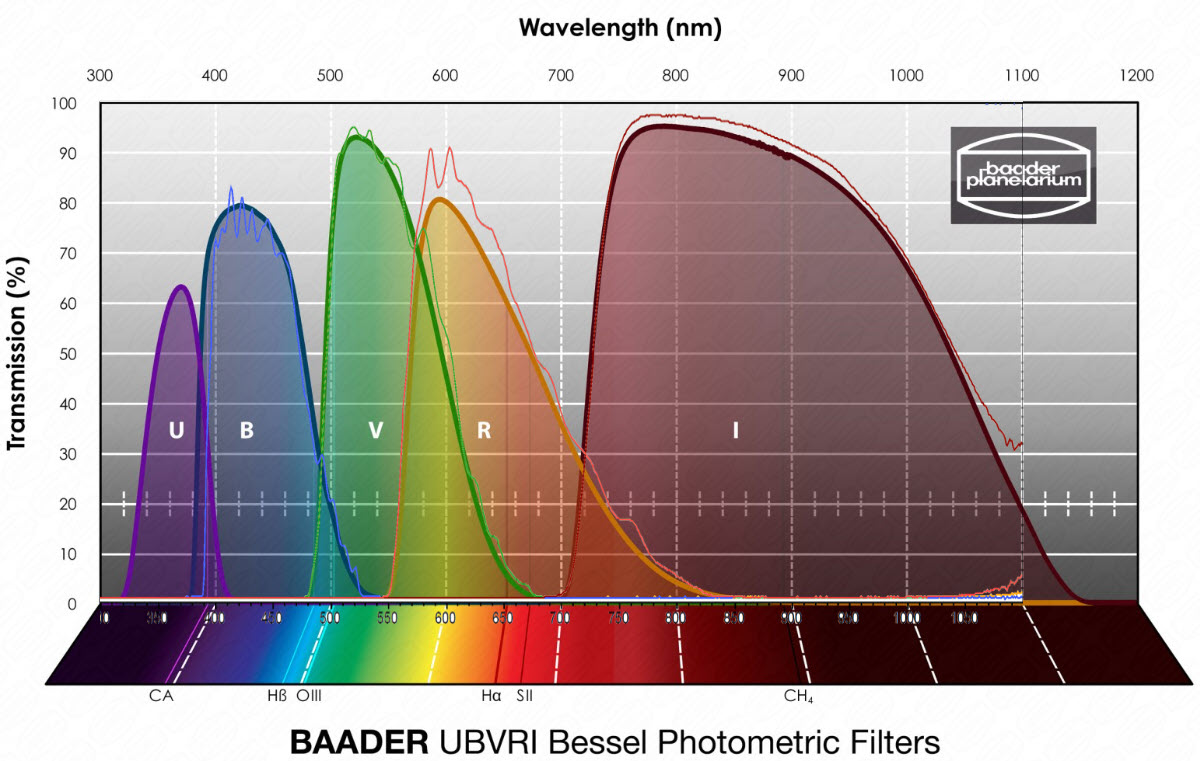
I'd love to hear comments and maybe learn a little something more from this exercise. And I hope this information is helpful to other observers searching for filters of their own.
Thanks,
Mike Wiles
Mesa, AZ
I'm no expert either, but it seems a 1um cutoff filter would help eliminate the red IR passband.
Peter
The B,V,R passbands look generally ok; some wiggles that may cause problems on some exotic stars, but should be fine for most targets.
The I passband is a bit concerning. You have to convolve the passband with the sensor QE, which is why the combined passband will decrease more in the 900-1000nm range than is shown by the raw filter passband, but it means that the red edge of the passband is ill-defined.
The spectrophotometer curves on the Baader forum from another customer show "red leaks" in the passbands, but they are all out at 1100+ nm, which is beyond the sensitivity limit of silicon and so are irrelevant.
The "proof is in the pudding". Try a set of Baader filters and see what the transformation coefficients look like.
Arne
"You have to convolve the passband with the sensor QE, which is why the combined passband will decrease more in the 900-1000nm range than is shown by the raw filter passband, but it means that the red edge of the passband is ill-defined."
'"Try a set of Baader filters and see what the transformation coefficients look like."
Arne,
If this (red edge of the Baader I passband) were a significant problem what would we see in the R-I and V-I transforms. Would we also need to see the effects on measurements of red stars?
Phil
Hi Phil,
The lack of a true red edge on the filter would most likely result in poorer transformations for red stars. Red stars are difficult anyway, because they typically have colors that are redder than any of the Landolt (or cluster standard) stars, and so require extrapolation of data. Red stars are also difficult because their spectrum is chopped up with molecular bands, making photometry with filters with slightly different passbands hard to compare. You could get around a lot of this if you had comp stars of similar color, but they tend to be variable themselves. :)
Before I say much more about this issue, I'd like to study the filters more myself. I'll be doing a theoretical post on the new filters from Baader and Chroma towards the end of the month.
Arne
In principle there should be no serious problem with the transformations as long one includes several 'very red' stars in the standard-star set. Expect the transformation to be non-linear, at least a quadratic if not a cubic. An example is shown in J. Allyn Smith's Sloan standards paper:
https://ui.adsabs.harvard.edu/abs/2002AJ....123.2121S/abstract
...specifically look at Figure 15 at the very bottom of the paper. This deals with a red leak in the Sloan u filter he used. Expect something similar in transforming very red stars with an open-ended Ic filter (or any such filter), since in effect you're dealing with a red leak. For the extreme cases in the plot, Smith specifies the stars --- there's your target list of test stars, by the way. As has been pointed out, for the Baader I filter, which is basically open toward long wavelengths, the transformation will depend on how the sensitivity of one's detector falls off redward, which may itself depend on ambient temperature, possibly atmospheric water-vapor level as well because of a strong (and variable) H2O absorption band around 9500A.
Arne argues that the red reference stars are likely variable, and that targets can be redder than any of the standards. Well, yes if you don't pay attention. The trick is to find either strongly reddened late-K giants or, especially, old dead (non-active) M dwarfs that have been calibrated by reliable observers. Even if they are slightly variable in V, the variation in the V-I color-index (say) will be negligible, especially given the likely errors involved in one's own data. So I disagree with the old lore that the situation is unworkable. Plenty of the old M-dwarfs are not only Landolt standards but are also original primary UBV standards, and are simply not variable at the level we're talking about (a couple percent at most). The standards in V-I color-index are defined out to V-I = 4.00, anchored by the M-dwarf star Wolf 359, a Landolt standard. Unless you work with faint, strongly obscured stars, this will cover most cases you'll run into. It does mean you want to observe that star whenever you have the opportunity (October through May) as a check on your system.
An example is Wolf 358 = EE Leo (V-I ~2.8, only a couple degrees from Wolf 359), whose GCVS designation is based on the modest range of V magnitudes reported in the literature --- not accounting for likely transformation errors in the source data, where the red star is wagging up/down at the end of the transformation fit. It is also a low-weight Landolt star. From my observations this past spring Wolf 358 varied by 0.03 mag full amplitude in V with a period of about 65 days (i.e. the rotation period of the star). Just a straight-line fit through the data, ignoring the variation, gives rms scatter only 0.010 mag. Since the variation is from starspots, the range in the I filter would be something like 3x smaller, down in the millimag range. So this star is plenty stable enough to use as a standard in the far-red.
Similarly I have looked at the northern Landolt standard SA 41-204, which is a moderately-reddened early-M giant (Landolt V-I = 2.24). On 28 nights (so far) from 2020 Aug to 2022 Jul, whatever variation there is is below 0.01 mag rms in V. This was done differentially against three bright, fairly red non-Landolt stars, so there are potentially three more pretty good red stars to be calibrated in the standard system in this field.
In case it helps, I have made a stripped-down list of red stars (mainly V-I > 2.0) from my working file of standard stars, copied here:
https://ftp.lowell.edu/pub/bas/starcats/red-std.txt
This includes coordinates (proper motions in milliarcsec/year for the M-dwarfs are important to find them 'tonight'), V, V-I, and the source. Some bright and some faint stars, though remember they'll be ~ 3 mag brighter at I than in V. Several of the stars are in the J. Allyn Smith plot. Many are in fields that have blue and intermediate-color stars as well as the red ones. Mostly equatorial or northern, but a few between -25 and -30 Dec that I am using for extinction determinations.
\Brian
Hi Brian,
My point was regarding differential photometry in a field - it is difficult to find a suitable red non-variable comp star. If you could, then the color difference could be small and transformation errors also small. I agree that reddened K/M stars can be used for determining transformation coefficients, as Landolt did in his seminal papers. So if you can't find a good red comp star, then transformation is important, and higher-order terms than are available through most transformation coefficient generating programs are usually necessary for these filters without a defined red edge.
Arne
In the usual case of having only F/G dwarfs and K giants among the comp stars in the field of a Mira (say) means, it seems to me, that it is _essential_ to know the color transformation for one's system at least approximately. One would have to know (or measure) the color of the variable as well, say V-I near max/min for the Mira. These are now available (or can be derived) for almost everything, so this shouldn't be an issue. But the fact that most of the AID data are not transformed at all really needs to be worked on. Tom Calderwood has touched on these and related points in his comprehensive report from last winter, and they were discussed on the list under that topic.
Meanwhile folks should be encouraged to take data on standards to get a good feeling for color terms. If the sky is good enough to observe that red variable, it is also good enough to hit a standard field before/after.
Arne notes: "...higher-order terms than are available through most transformation coefficient generating programs are usually necessary for these filters without a defined red edge." Software folks should add a quadratic option. Especially at extreme colors it won't matter what filter you have, since it's bound to veer off being linear. Even Arlo Landolt's various instrumental systems were nonlinear in practically all the colors. He had to apply little fixes to everything because he started with only linear fits, and the filters supplied to him at the national observatories didn't match the standard ones either. Look at the figures in the 1992 paper to see the hoops he had to jump through. Again I'll recommend reading appendix B of Peter Stetson's 2019 globular clusters photometry paper:
https://ui.adsabs.harvard.edu/abs/2019MNRAS.485.3042S/abstract
...about the whys/wherefores of transformations. Section 3 of the text is useful, too.
\Brian
Brian,
Very interesting. I have seen some evidence of a second order curvature in the SA-110 fits using the two fainter red extension stars. The very blue and very red ends droop just a bit in some of the fits. I haven't done any extra statistical tests yet to see if a 2nd order fit is significant, however. At some point I'll do that but I have a gut feeling at least with my hardware we are in the noise of it all. Btw, I have BVRI 1.25-inch Astrodon filters, Atik490EX mono CCD, and SkyWatcher Esprit 100.
(DEY)
I just got my B V and I filters from Baader and did a transformation, with standard field NGC 7790
This is what came out:
I am not an expert on this. So if anyone can comment on it if it is any good?
[Coefficients]
Tbv= 1.113
Tb_bv= 0.101
Tb_bi= 0.053
Tbi= 1.063
Tv_bv= -0.030
Tvi= 1.019
Tv_vi= -0.021
Ti_vi= -0.009
[Error]
Tbv= 0.014
Tb_bv= 0.048
Tb_bi= 0.024
Tbi= 0.005
Tv_bv= 0.039
Tvi= 0.006
Tv_vi= 0.039
Ti_vi= 0.007
[R Squared Values]
Tbv= 0.993
Tb_bv= 0.079
Tb_bi= 0.087
Tbi= 0.999
Tv_bv= 0.009
Tvi= 0.998
Tv_vi= 0.004
Ti_vi= 0.032
I just have the Baader B & V filters. I am just getting into transformation and have generated my first set of transform coefficients using the Landolt field SA41.
[Coefficients]
Tbv= 1.077
Tb_bv= 0.075
Tv_bv= 0.035
[Error]
Tbv= 0.048
Tb_bv= 0.034
Tv_bv= 0.015
[R Squared Values]
Tbv= 0.980
Tb_bv= 0.323
Tv_bv= 0.284
This field only uses around 14 standard stars and non of then are strongly blue (lowest B-V is around 0.2). So I probably should image another field and average the results.
Your coefficient don't seem terribly close to mine but maybe that is due to differences in the scope and camera.
Any comments about these would be welcome.
Here are my transforms for newly purchased Baader BVRc and Ic filters as determined using M67 (Meade 16" f/6.4 and ZWO ASI2600MM Pro CMOS detector):
[Setup]
description= TG - Version 6.9a, Telescope= DBO-4, Time created (UT) = 2023_05_12_15:11:44
[Coefficients]
Tbv= 1.206
Tb_bv= 0.215
Tbr= 1.243
Tb_br= 0.148
Tb_bi= 0.116
Tbi= 1.134
Tv_bv= 0.031
Tvr= 1.349
Tv_vr= 0.064
Tr_vr= -0.195
Tri= 0.834
Tr_ri= -0.235
Ti_ri= -0.063
Tvi= 1.055
Tv_vi= 0.035
Ti_vi= -0.027
Tr_vi= -0.104
[Error]
Tbv= 0.040
Tb_bv= 0.024
Tbr= 0.020
Tb_br= 0.015
Tb_bi= 0.014
Tbi= 0.013
Tv_bv= 0.049
Tvr= 0.070
Tv_vr= 0.099
Tr_vr= 0.071
Tri= 0.045
Tr_ri= 0.093
Ti_ri= 0.083
Tvi= 0.038
Tv_vi= 0.055
Ti_vi= 0.035
Tr_vi= 0.038
[R Squared Values]
Tbv= 0.926
Tb_bv= 0.544
Tbr= 0.975
Tb_br= 0.555
Tb_bi= 0.537
Tbi= 0.991
Tv_bv= 0.018
Tvr= 0.792
Tv_vr= 0.027
Tr_vr= 0.136
Tri= 0.894
Tr_ri= 0.135
Ti_ri= 0.013
Tvi= 0.929
Tv_vi= 0.033
Ti_vi= 0.010
Tr_vi= 0.134
Kevin
I have always been puzzled as to why R aquared values are included in transformation coefficient results. It seems to me they add no useful information. The closer the coefficient is to one (steep plot, colour transforms such as Tbv) the closer the R squared is to one. The closer the coefficient is to zero (plot close to horizontal, filter transforms such as Tv_bv) the closer the R squared is to zero.
Roy
Interestingly, in the professional photometry literature one very rarely sees the use of the correlation coefficient r-squared to evaluate transformations. It looks to me from the examples here that one can have a high r value (say > 0.95) for a somewhat ragged transformation, yet a poor one (like 0.15) for a transformation that is adequate. I'm not saying it's wrong, but only that it is inappropriate for the task at hand. What one would like to see are plots of the relations and also plots of residuals.
Ben Taylor and Mike Joner have discussed these issues in a number of papers. One might start with:
https://ui.adsabs.harvard.edu/abs/2006PASP..118.1716T/abstract
Note here particularly Figures 1 and 2, and related text in section 8.4 (i.e. why you need to look at both sorts of plots). They are discussing transformations among related datasets, but the precepts involved are identical when going from instrumental magnitudes to standard ones. Their example in appendix B is illustrative. Despite the high statistical rigor of the various Taylor & Joner papers, the r-squared statistic _never_ appears.
\Brian
I am doing similar measurements with a $275 LDC 721 spectrophotometer. It scans 350 to 1020 nm. That works for me because I don't use U band and my CCD quits at 1000nm. A very inexpensive way to check for in-band leaks. Kind of fun and satisfying to do it by hand with a simple instrument.
You can also do a very crude scan with the AS7341 chip. Looking forward to a 100 channel version of it.
Ray