| Then with nostrils wide distended, Breaking from his iron chain, |
| And unfolding far his pinions, |
| To those stars he soared again. |
| Longfellow's "Pegasus in Pound." |
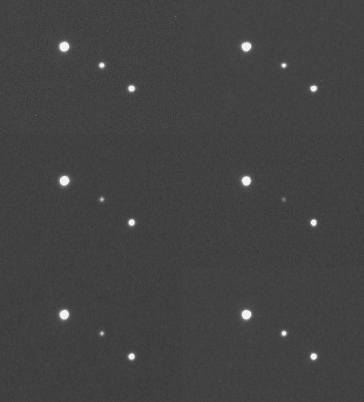 |
| Image of an IP Peg eclipse by Gianluca Masi, from Bellatrix Astronomical Observatory, Ceccano (ITALY). |
The remarkable U Gem-type dwarf nova, IP Pegasi, is an eclipsing binary system with a long orbital period (3.80 hours) that shows evidence of spiral arms in its accretion disc. For these reasons and more, IP Peg is an excellent candidate for studying accretion disc evolution, outburst mechanisms and the difference between long and short period systems. IP Pegasi was first discovered to be variable in 1981 by Lipovetskij and Stepanyan (1981) and was originally named the Soviet Variable Star (SVS) No.2549. The outburst of IP Peg is seen in the Palomar Sky Survey charts and was studied by a group of amateur variable star observers using the Moscow plate collection. Discovered to be an eclipsing system by Goranskij et al (1985), IP Peg is one of the few eclipsing dwarf novae for which the inclination of the orbital plane is large enough for the companion star to eclipse the white dwarf primary, the accretion disc, and the hot spot (the place where the gas stream hits the outer of edge of the accretion disc). By studying these deep eclipses, information about accretion disc evolution and outburst mechanisms in dwarf novae are discovered.
Up-close and eclipsing with IP Peg
IP Pegasi is an interacting binary system in which a white dwarf primary star receives mass from a late type star (that has a filled Roche lobe) via a mass stream and an accretion disc. A bright spot (also called the "hot spot") is evident where this mass stream hits the accretion disc. These accretion-disc-fed-systems, called cataclysmic variables (CVs) are excellent systems to study owing to their proximity and the frequency of their outbursts which may occur on time-scales of weeks to years. Several CVs have been featured as the VSOTM where more information about these stars can be found.
IP Peg is a member of the subclass of CVs known as dwarf novae, specifically, a U-Gem type dwarf nova which displays semi-periodic outbursts during which the system brightens by several magnitudes as more mass is suddenly transferred through the disc. IP Peg is not only a dwarf nova, but it is one of the few eclipsing dwarf novae for which the inclination of the orbital plane (~80 degrees) is large enough for the 0.5 solar mass companion star to cover the 1.02 solar mass white dwarf and most of the accretion disc as it passes in front every 3.8 hours (Steeghs 1997). IP Peg is one of the brightest deeply eclipsing dwarf nova known with an orbital period above the period gap of 2-3 hours in the orbital period distribution of cataclysmic variables (U Gem also has a period above the gap). IP Peg is an essential object to study to understand the differences between long- and short-period systems (Webb 1999).
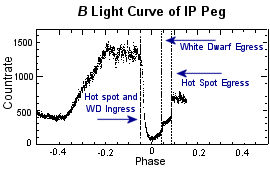 |
| Fig. 1: B eclipse light curve of 1992 November 27. The lateral dashed vertical lines indicate the first and last contact points of the hot spot eclipse, while the central lines marks the white dwarf eclipse egress phase as measured by [Wood et al. (1989b)]. The data was obtained by Erho Zhang with the Stiening 4-color photometer on the 2.1-meter telescope at McDonald Observatory. |
The light curve of IP Peg displays both the eclipsing variability of the system, which occurs every 3.8 hours, and the dwarf novae outbursts, which have amplitudes of about 2 magnitudes and recur roughly every 3 months. These "inside-out" type dwarf nova outbursts of IP Peg are discussed below. The eclipsing variability of IP Peg is shown above in figure 1. It is characterized by a large orbital hump which is due to the maximum visibility of the hot spot and other visual components of the system. Then the hot spot and the white dwarf enter eclipse and the light curve declines. The white dwarf and the hot spot enter eclipse simultaneously, making the individual components indistinguishable on the light curve. The white dwarf exits the eclipse before the hot spot, but the hot spot makes a more profound emergence because it is considerably brighter than the white dwarf. A model of an IP Peg eclipse is shown below.
| IP Peg Eclipse | |||
 |
 |
 |
 |
| 1. The hot spot (white spot left of center) is at maximum visibility as it leads the secondary around the white dwarf star. | 2. All of the system's component's are visible producing near-maximum total luminosity. | 3. The primary white dwarf star, a portion of the hot spot, and much of the accretion disk is eclipsed by the secondary companion. | 4. The primary white dwarf star is out of eclipse; however, the hot spot is still covered by the companion. |
Observations of IP Peg's eclipses during a dwarf nova outburst and during quiescence, reveal important information about the outburst mechanisms and disc evolution of these stellar systems.
From the Inside-Out
By studying the eclipse light curves of IP Peg during an outburst phase, researchers determined that the outburst originated in the inner portion of the disc and then moved outward, calling it an "inside-out" type outburst. Currently, the accepted "disc instability" theory for dwarf nova outbursts (Osaki 1974) states that outbursts occur when, in normal (quiescent state) accretion, the surface density and temperature of the disc reach an unstable state; the temperature and radiation level then rise quickly and material stored in the disc is dumped onto the primary star. Depending on system parameters (e.g. orbital period, diameter of the secondary, etc.) and possibly on its recent history, disc heating may begin either at the outer or inner edge of the disc, thus giving rise respectively to either "outside-in" or "inside-out" outbursts. When the trigger is in the inner disc, a heating wave pushes outward, creating an "inside-out" outburst. Likewise, if the trigger is in the outside of the disc, the heating wave pushes inward, creating an "outside-in" outburst. In the observed outbursts of IP Peg, the eclipse light curves reveal the true nature of this outburst.
During the outburst of IP Peg in September-October 1997, the eclipse light curves were studied and it was concluded that the outburst originated from the inside of the disc and moved outward. The eclipses that occur at the beginning of the outburst are near-total implying that the bright regions are small enough to be entirely eclipsed by the secondary. Thus the outburst is confined to the inner disc. Also, the eclipse morphology is initially flat-bottomed indicating that the object eclipsed is compact. By the peak of the dwarf nova outburst, the larger flux at mid-eclipse suggests that the outburst has spread to the outer disc and has grown so that it is visible around the limb of the secondary. The shape of the eclipse has also become more 'V'-shaped which shows that the eclipsed object is less compact (Webb et al. 1999). A light curve of IP Peg on the rise to outburst is shown below. Notice how the evolution of the eclipses illustrate the "inside-out" characteristic of the dwarf nova outburst.
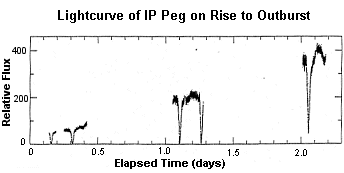 |
| Initially the eclipses are near total, implying that the bright regions are small enough to be entirely eclipsed by the secondary. Thus the outburst must be confined to the inner disc. Later, the flux remaining at mid-eclipse implies that the outburst has spread to the outer disc, which is not entirely eclipsed. This was therefore an "inside-out" outburst. (Data courtesy of Natalie Webb and Tim Naylor.) Credit: Hellier 2001, Chapter 5, Figure 2 |
Spiral Shocks in the disc of IP Peg
Just when you thought IP Peg couldn't get any more interesting we discover that it was the first star to show evidence of spiral arms in its accretion disc (Steeghs 1997)! Hellier (2001) provides a good description of how spiral shocks behave in a cataclysmic variable: In a system like IP Peg, if the white dwarf star existed with no secondary companion interacting with it, the gravitational field around the white dwarf would be symmetric, and thus the orbits in the surrounding disc would be circular. But the secondary star does exist and the gravity from this star breaks the symmetry around the white dwarf, producing non-circular orbits in the accretion disc. Gas in the disc, orbiting much faster than the speed of sound, tries to follow the non-circular orbits, but in doing so it forms shocks. Such shocks slow down the gas, converting its energy into turbulence and heat. For an analogy consider fast-moving traffic on a busy road. A simple lane change can force the car behind to brake, hence forcing the car behind that to brake harder, and so on. In heavy traffic such 'shocks' can bring traffic to a halt, even when the road is otherwise clear. The cars move slowly through the shock and then speed up again. If lower speeds are enforced by speed restrictions, and if lane swapping is discouraged, no shocks form and the overall flow of traffic can be increased.
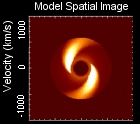 |
| Fig. 2: The calculated position map of the IP Pegasi accretion disk reveals a striking two armed trailing spiral pattern. Credit: D. Steeghs, E. Harlaftis, K. Horne, Astronomy Group, Univ. St.Andrews |
In accretion discs, shocks have long been expected for this reason, and they have appeared in computer simulations which model discs using the equations of gas hydrodynamics. The usual result is a two-armed, spiral-shaped shock similar to that seen in Fig. 2. The spiral shape arises since the faster orbits in the inner disc 'wind up' the shock. This is reminiscent of the spiral structure seen in many galaxies. Indeed, the spiral arms in galaxies may be shocks induced by interactions with neighboring galaxies, which perturb the galactic orbits in the same way that the secondary perturbs the disc.
In 1997 the observations of spiral shocks in cataclysmic variables were first reported. Danny Steeghs and colleagues analysed the emission lines of IP Peg near the peak of an outburst, and found variations in the line profiles that matched those expected from a spiral structure. Indeed, the spiral structure became apparent when analysed by an imaging technique called Doppler tomography.
It is currently unclear how widespread or important such shocks are as they have only been seen in a few stars, and then only during outburst. It may be that the shocks in many cataclysmics are too weak to be significant, or it may be that spiral shocks play a vital role in allowing material to flow through a disc. One of the long-standing problems in understanding accretion discs is to explain their angular momentum transport mechanisms. In order to sustain the observed mass transfer rates, highly efficient viscous processes must be available to transport the angular momentum outwards. The shocks, through slowing material down, transfer angular momentum outwards through the disc, and so might drive accretion in the absence of other forms of viscosity. However, theory suggests that spiral shocks could not create enough viscosity to be the sole contributors to angular momentum transport (Hellier 2001).
Doppler Tomography
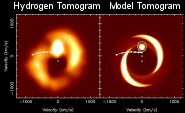 |
| Fig 3. Click image to enlarge. The left panel shows a doppler tomogram of hydrogen gas in IP Peg. The relative brightness corresponds to the intensity of light emitted by Hydrogen gas moving at the indicated velocity. On the right is a simple model velocity field consistent with the measurements. Credit: D. Steeghs, E. Harlaftis, K. Horne, Astronomy Group, Univ. St.Andrews |
Doppler tomography is used to show the spiral pattern in the accretion disc of IP Peg, but what is Doppler tomography? Danny Steeghs of the University of St. Andrews Astronomy Group says that, "Doppler tomography is an indirect imaging technique that allows one to spatially resolve the accretion flow in interacting binaries even though these objects are point sources". The technique was popularized by Tom Marsh and Keith Horne (1988) and holds exciting possibilities for the future. Hellier (2001) describes it as a visual technique that humans may respond to more readily than just picking out features from a sequence of spectra. However, directly translating the line emission into a picture of a disc would require knowledge of the velocity at each point in the disc, which is information that we do not have without making dubious assumptions. We can though, take a half-way step and create a map of the velocities within the disc without translating these into positions.
Hellier (2001) describes how this can be done and talks about the benefits and risks of using the technique of doppler tomograms in this excerpt from chapter 3 of his book (It will help to remember that an 'S'-wave is the S shaped pattern seen in a sequence of spectra, taken over an orbital period, of a region circling with the orbital motion. It is a result of the blue-shifted lines seen when the region is moving towards us and the redshifted lines we see as the material moves away from us half an orbit later.) :
The orbital motion of a small region of disc is specified by a velocity and a phase. This can be plotted on a polar diagram (r, theta) where the vector length r represents the speed of the motion and the angle theta from the vertical represents the phase (360 degrees corresponding to one cycle). Each location on such a diagram produces an S-wave — indeed if one rotated the diagram about its origin, the projection of the feature onto the (stationary) x-axis would trace out the S-wave.The essence of tomography is to perform the reverse process, using a set of spectra taken over the orbital cycle. For each location in the velocity plot, one adds up the flux along the track of the corresponding S-wave, and shades the location in proportion to the total flux. The result is a tomogram [similar to the one in Fig. 3].
In a tomogram the secondary, being closest to us at phase 1, is at the top; similarly the primary is also on the y-axis, shifted below the origin by its orbital velocity. The disc in a tomogram is still circular, and centered on the white dwarf's velocity, but is 'inside-out', the low-velocity (outer) regions being nearer the origin. If the orbital period, mass ratio and inclination of the system are known, then the Roche geometry, stellar velocities, and the velocities along the stream can be calculated and plotted on the tomogram, as an aid to interpretation. If, though, the phasing of the orbit is uncertain, as is often the case in non-eclipsing systems, any phase error leads to a rotation of the tomogram.
There are two assumptions of tomography that can cause problems. First, it assumes that all components have the same mean velocity with respect to Earth. This will be valid for anything orbiting in the binary plane, but is violated by material moving out of the plane. Emission from such material will appear 'defocused' in the tomogram. More seriously, tomography assumes that a component is equally visible at all orbital phases. Thus occultation or optical-depth effects which change the visibility of components can produce spurious features in the tomogram.
Overall, the advantage of Doppler tomography is that considering spectra in a different way stimulates the thought processes when interpreting observations. However, a velocity plot is hardly more intuitive than a time-resolved sequence of spectra. It is also possible for tomography to introduce artifacts, so one should be sceptical of any interpretation that cannot be sustained by inspection of the trailed spectra themselves.
Perhaps the true potential of tomography will come from combining it with eclipse mapping, so that the spatial information from the eclipse combines with velocity information from the tomograms to produce a genuine picture of a disc. This, though, is still under development, primarily because it would require spectacularly good data, with high-quality spectral profiles obtained every few seconds to match the time resolution used in eclipse mapping.
Observing IP Peg
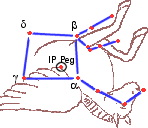 |
| Image shows location of IP Peg in the constellation Pegasus. |
In Greek mythology, Pegasus is the name of a good-natured, obedient, magnificent winged horse that was born from Medusa and later carried the thunderbolts of Zeus (Olcott 1911). For our purposes, however, Pegasus is the constellation that holds the eclipsing dwarf nova star IP Pegasi, as well as another popular CV, RU Peg. IP Peg may be observed in early December evenings from the Northern hemisphere. The variable is located in the south-westerly corner of the "Great Square of Pegasus" and ranges from about 12 to 18 visual magnitudes making it an excellent target for both visual and CCD observers. In its normal quiescent state outside of eclipse, the brightness is around 15 magnitudes, then, during eclipse, it will decline about 3 magnitudes. In its outburst state, the visual magnitude range of the system outside eclipse is 12 to 13.5 magnitudes with eclipses that are typically 1.5 to 2.0 magnitudes deep (except at the beginning and end of the outburst when they are deeper). AAVSO Charts will help locate this variable star in the sky.
Eclipses of IP Peg can be observed in all stages of its outburst light cycle. Visual observers using telescopes in the 25-40 cm aperture range should be able to cover most eclipses to minimum light that occur during an outburst. In order to follow the rapid light changes which occur during eclipses, estimates should be made as frequently as possible without sacrificing accuracy. A useful guideline is about one estimate per minute (Worraker, web page). Observers should then submit their observations of IP Peg to the AAVSO to be incorporated into the AAVSO International Database. Enjoy observing this interesting and rewarding variable star!
For More Information
- Bruch, A., "Studies of the flickering in cataclysmic variables", 2000, web page.
- Dombrowski, M. "IP Pegasi: Cataclysmic Stellar Variability with Eclipsing Binary Superimposition", Journal of the American Association of Variable Star Observers, 26, 1998, 127-131.
- Goranskij, V.P., Shugarov, S.Yu, Orlowsky, E.I., Rahimov, V.Yu, 1985, IBVS No.2653.
- Harlaftis, E.T.; Steeghs, D.; Horne, K.; Martin, E.; Magazzu, A., "Spiral shocks in the accretion disc of IP Peg during outburst maximum", Monthly Notices of the Royal Astronomical Society, 306, 1999, 348-352.
- Hellier, C. Cataclysmic Variable Stars: How and Why They Vary, Springer, Praxis Publishing Ltd, Chichester, UK, 2001.
- Lipovetskiy, V.A., Stepanyan, J.A., Astrofizika 17, No. 3, 573, 1981.
- Marsh, T. and Horne, K., "Images of accretion discs - II. Doppler Tomography", Monthly Notices of the Royal Astronomical Society, 235, 1988, 269-286.
- Olcott, William Tyler. "Star Lore of All Ages: A collection of Myths, Legends, and Facts Concerning the constellations of the Northern Hemisphere". The Knickerbocker Press, New York, 1911.
- Osaki, Yoji. "An Accretion Model for the Outbursts of U Geminorum Stars", Publicattions of the Astronomical Society of Japan, 26, 1974, 429-436.
- Osaki, Yoji. Invited Review Paper: "Dwarf-Nova Outbursts." Publications of the Astronomical Society of the Pacific, 108, January 1996, 39-60.
- Steeghs, Danny. "Spiral Structure in a stellar accretion disc", Web Page.
- Steeghs, D., Harlaftis, E.T. and Horne, K., "Spiral structure in the accretion disc of the binary IP Pegasi". Monthly Notices of the Astronomical Society, 290, 1997, L28-L32.
- Webb, N.A.; Naylor, T.; Ioannou, Z.; Worraker, W.J.; Stull, J.; Allan, A.; Fried, R.; James, N.D. and Strange, D. "A spatially resolved 'inside-out' outburst of IP Pegasi", Monthly Notices of the Royal Astronomical Society, 310, 1999, 407-413.
- Wood, J.H.; Marsh, T.R.; Robinson, E.L.; Stiening, R.F.; Horne, K.; Stover, R.J.; Schoembs, R.; Allen, S.L.; Bond, H.E.; Jones, D.H.P.; Grauer, A.D. and Ciardullo, R. "The ephemeris and variations of the accretion disc radius in IP Pegasi", Monthly Notices of the Royal Astronomical Society, 239, 1989, 809-824.
- Worraker, W.J., "IP Pegasi - Outbursts and eclipses", Journal of the British Astronomical Association, 110, 2, 2000, p.104.
This month's Variable Star of the Month was prepared by Kate Davis, Technical Assistant, Web.

