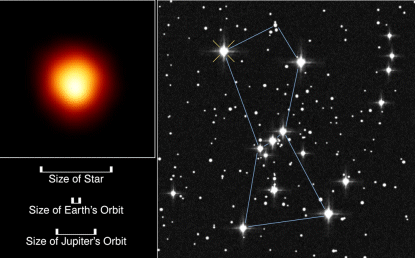
 The pulsating red supergiant Antares (“anti-Mars”), at V = 1.06, is the 15th-brightest star in the night sky, but it gets less attention than its near-twin Betelgeuse. Check the length of their entries in wikipedia, for instance. Or search the AAVSO website; a search of “Betelgeuse” yields about 20 items; a search of “Antares” yields none! Perhaps it's because of Antares' -26o declination, or its less-interesting name. Nevertheless, anything that we learn about Betelgeuse, such as from the Betelgeuse Workshop 2012 (Kervalla et al. 2013) – helps us to understand both stars – and all red supergiants. Both stars are typical massive M2 supergiant stars, 500-600 light years away. Betelgeuse is slightly brighter (V = 0.45), perhaps because it is slightly more luminous. Both are extremely complex – convecting, pulsating, rotating, and shedding mass at a prodigious rate. But recent spectroscopic and photometric studies of Antares are beginning to solve some mysteries – and raise others.
Antares is so extreme that its properties are only approximately known. The present mass is of the order of 15 solar masses; the total luminosity is roughly 100,000 times that of the sun; its age is about 11 million years. Its angular diameter – 41.3 ± 0.1 milli-arcsec – is well-known from lunar occultations; Antares lies near the ecliptic. The problem is translating it into a radius: Antares is a very “fuzzy” star, with strong limb-darkening of the photosphere, a massive wind, and an atmosphere whose opacity depends on wavelength. At wavelengths where the atmosphere is opaque, the star looks larger. A reasonable estimate of the radius would be 800-900 solar radii. This means that, if Antares was where the sun is, we would be well inside it! Red Antares A has a hot blue companion Antares B, a B2.5 main sequence star, about 2.5” away, and five magnitudes fainter. Antares AB is on several lists of “interesting double stars to observe”, but requires good sky conditions and a largish telescope to resolve the pair. So when we discuss the variable, we should really say Antares A, but we shall just call it Antares here.
Bright variables are a photometric challenge: nearby comparison stars are hard to find. The situation is even worse for red variables, since any comparison star of similar color would surely be variable. Most of Antares' neighbors are B stars in the Sco-Cen association. And Antares' visual amplitude is only a few tenths of a magnitude, and its variability is semi-regular at best.
For spectroscopists, an excess of photons is no problem. My colleague David Gray at Western University in London, Ontario, has been carrying out systematic, sustained, high-resolution observations of Antares (and Betelgeuse) with a 1.2m telescope for many years. This enables the measurement of the strength, depth, and shape of spectral lines, as well as the radial velocity. His doctoral student Teznie Pugh has recently published an analysis of these data: Pugh and Gray (2013ab) find a dominant spectroscopic period of 2167 +/- 5 days, which they ascribe to some kind of pulsation, and a period of 100 +/- 6 days which they ascribe to solar-like oscillations driven by large-scale convection. They predict a brightness variation of 0.2 mag on the longer period, based on their radial velocity and line-depth ratio variations. Indeed, when the AAVSO visual observations are phased to this period, the amplitude is about 0.2 mag. There do not appear to be photometric variations on the shorter timescale.
AAVSO observers, despite the challenges, have measured Antares visually since 1945 and photoelectrically since 1981 (see Figure 2). Initial analysis of the PEP observations (Percy et al. 1996) gave a period of 350 days, in agreement with a spectroscopic period published by Smith et al. (1989). Subsequent PEP observations are rather scattered; they need to be obtained with special care.
For small-amplitude variables like Antares, there are two additional problems. There may be a spurious period of one year in visual data, due to the Ceraski effect, a physiological effect in visual observing. In fact, there could be a spurious period of one year in PEP data, if the large extinction and transformation corrections have not been accurately made. There are also “alias” periods, separated from the true period by ±N (usually 1 or 2) cycles per year, and these are a special problem if the true period is a few hundred days. Kiss, Szabo, and Bedding (2006) have analyzed AAVSO visual data, and found a period of 1650 ± 640 days. Equally important: they found evidence, from the Lorentzian shape of the peaks and the 1/f noise in the power spectrum, that the pulsations were driven by stochastic excitation by convective motions. Percy and Sato (2009) obtained weak evidence for a period of about 1700 days using self-correlation analysis. Hipparcos photometry is limited, and difficult, but suggests an amplitude of 0.2 on a time scale of ≥ 1000 days.
An “elephant in the room”, however, is the “long secondary period” (LSP) -- a period which is an order of magnitude longer than the fundamental radial period, and is found in about a third of all pulsating red giants and supergiants. Its nature and cause are unknown (Nicholls et al 2009), so we do not know how it fits into the mystery. The 2167-day period obtained by Pugh and Gray (2013ab) is consistent with the LSP-luminosity relation obtained by Yang and Jiang (2012) from an extensive analysis of red supergiants in the Small Magellanic Cloud and in the Milky Way. Likewise: a 350-day pulsation period, and a 2000-day LSP would be consistent with the period-luminosity relations given by Kiss et al. (2006). The 350-day period is also consistent with the period-luminosity relation found by Fadeyev (2013) from hydrodynamic models of pulsation. If the 350-day period is indeed real, and due to pulsation, it would not be a simple pulsation. The outer layers of the star are dominated by huge convection cells, so the pulsation could not be purely radial. And the star, with its bright convection cells, is slowly rotating, with a period which is probably 30-40,000 days.
Percy and Khatu (2014) have recently found another complication to studies of the variability of Antares and other red supergiants: the amplitude of their pulsation varies significantly, on time scales of about 20 pulsation periods. Results obtained at different epochs may therefore be different. And comparisons between their photometric behavior and e.g. their spectroscopic behavior may be misleading unless the observations are made at the same time. Incidentally, these changes in pulsation amplitude are also found in most pulsating red giants (Percy and Abachi 2013) and yellow supergiants (Percy and Kim 2014).
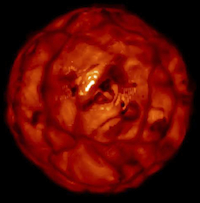
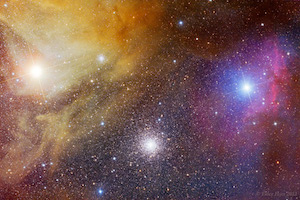
 Antares may appear as a point of light but, close-up, it would appear much more complex and impressive. As you approached it, you would see the Upper Scorpius portion of the Sco-Cen association, a group of a thousand stars, some of them hot and luminous. They would be embedded in emission and reflection nebulas of gas and dust from which stars are still forming. Supernova explosions, and the winds of hot stars have churned up the gas and dust. Approaching Antares, you would see the blue Antares B, and the red star's photosphere dominated by huge convective cells. Evidence of these can be seen in interferometric images of Antares (and Betelgeuse) and in hydrodynamic simulations of the photosphere (Figure 3). Antares is losing mass at the rate of several solar masses per million years, as a result of the photospheric activity and strong radiation field. Vast plumes extend upward into a surrounding nebula – which is both raw material of star formation, and by-product of stellar mass loss and death. The nebula, near the star, is energized partly by Antares' hot companion, Antares B (Figure 4), and shines partly by reflection. It's always fun to think about the variable stars that you are observing – what they are like, and what they are doing.
 Observing Antares is challenging, but worthwhile. The seven decades of existing visual observations are essential for understanding the complex, long-term variations in this star, and will become even more valuable as more decades of observations are added. Because there are few stars brighter than Antares, you may not be able to use the usual interpolation method of measuring it visually. Rather, you may have to use two slightly fainter comp stars to define a “step” of 0.1 mag, and then estimate the amount by which Antares is brighter than the brighter comp star.
AAVSO PEP observations of Antares have also been obtained; the comp stars were HR 6145 (V = 6.090, B-V = 1.088) and HR 6225 (V = 6.72, B-V = 1.16). Unfortunately, the brighter stars near Antares tend to be much bluer. But photometry with the fainter comp stars should be adequate, as long as corrections for sky, extinction, and transformation are carefully made.
References
- Chiavassa, A. et al., 2010, “Radiative hydrodynamic simulations of red supergiant stars. II. Simulations of convection on Betelgeuse match interferometric observations”, Astron. Astrophys., 515, A12, pp. 10.
- Fadeyev, Yu.A., 2013, “Non-linear pulsations of red supergiants”, Astron. Letters, 39, 260-270.
- Kervella, P., et al., 2013, Betelgeuse Workshop 2012, EAS Publ. Ser. 60, EDP Sciences, Les Ulis, France.
- Kiss, L.L., Szabo, G.M., and Bedding, T.R., 2006, “Variability in red supergiant stars: pulsations, long secondary periods, and convection noise”, Mon. Not. Roy. Astron. Soc., 372, 1721- 34.
- Nicholls, C.P. et al., 2009, "Long Secondary Periods in variable red giants", MNRAS 399, 2063.
- Percy, J.R. et al., 1996, “Small-amplitude red variables in the AAVSO photoelectric photometry program: light curves and periods”, Publ. Astron. Soc. Pacific, 108, 139-144.
- Percy, J.R. And Sato, H., 2009, “Long secondary periods in pulsating red supergiant stars”, J. Roy. Astron. Soc. Canada, 103, 11-15.
- Percy, J.R., and Abachi, R., 2013, “Amplitude variations in pulsating red giants”, JAAVSO, 41, 193-213.
- Percy, J.R., and Khatu, V., 2014, “Amplitude variations in pulsating red supergiant stars”, JAAVSO, 42, 1.
- Percy, J.R. And Kim, R., 2014, “Amplitude variations in pulsating yellow supergiants”, to be submitted to JAAVSO.
- Pugh, T., and Gray, D.F., 2013a, “The spectroscopic variations of Antares A -- two timescales of variation”, Astron. J., 145, A38, pp. 4.
- Pugh, T., and Gray, D.F., 2013b, “Short timescale variations in the atmosphere of Antares A”, Astrophys. J., 777, A10, pp. 6.
- Smith, M.A., Patten, B.M., and Goldberg, L., 1989, “Radial velocity variations in Alpha Ori, Alpha Sco, and Alpha Her”, Astron. J., 98, 2233-48.
- Yang, M., and Jiang, B.W., 2012, “The period-luminosity relation of red supergiant stars in the Small Magellanic Cloud”, Astrophys. J., 754, A35, pp. 22.
The Summer 2014 Variable Star of the Season was written by Dr. John Percy, University of Toronto.
A note for visual observers: Sebastian Otero (OSE) has a long history of making effective and accurate observations of bright, low-amplitude variables. We asked him for suggestions on observing this very challenging variable, and he made the following comments:
The problem with this star is that for observers in the Northern hemisphere the best stars in the sequence are too low in the sky, but the advice is: if you can't observe it properly, don't observe it at all! Because the amplitude is small and it doesn't make sense to follow 0.1 mag. variations with an error of 0.2 mag. in the estimate caused by the wrong choice of comp stars or by large airmass problems and differential extinction.
Alpha Sco is close to del Sco so the above issues are also valid for it. But the case is worse because it is red and we have no red comp stars and the range is even smaller for visual observers. Delta Sco may have long term variations >0.2 mag but even though alpha Sco extreme range is 0.73 - 1.19, the average cycle only goes from 0.9 to 1.1.
My basic sequence for Antares is:
- alp Cru V= 0.75 (combined brightness of ABC)
- alp Vir V= 0.98 (Mean brightness of slightly variable star)
- bet Cru V= 1.26 (Mean brightness of slightly variable star)
As you see, these stars are placed in the Southern hemisphere.
For Northern observers, the choice would be: alp Aql V= 0.77, which is too North for me, and alp Cyg V= 1.25 (also mean magnitude of a variable), although this latter is too far away for a good estimate to be made. So both stars are best placed for Southern observers visually speaking. Antares is very difficult to observe visually. Only its not so often larger amplitude cycles can be seen unambiguosly (like the minimum in 2009: http://www.aavso.org/vsx/docs/34002/133/alpSco_JD.gif).


