

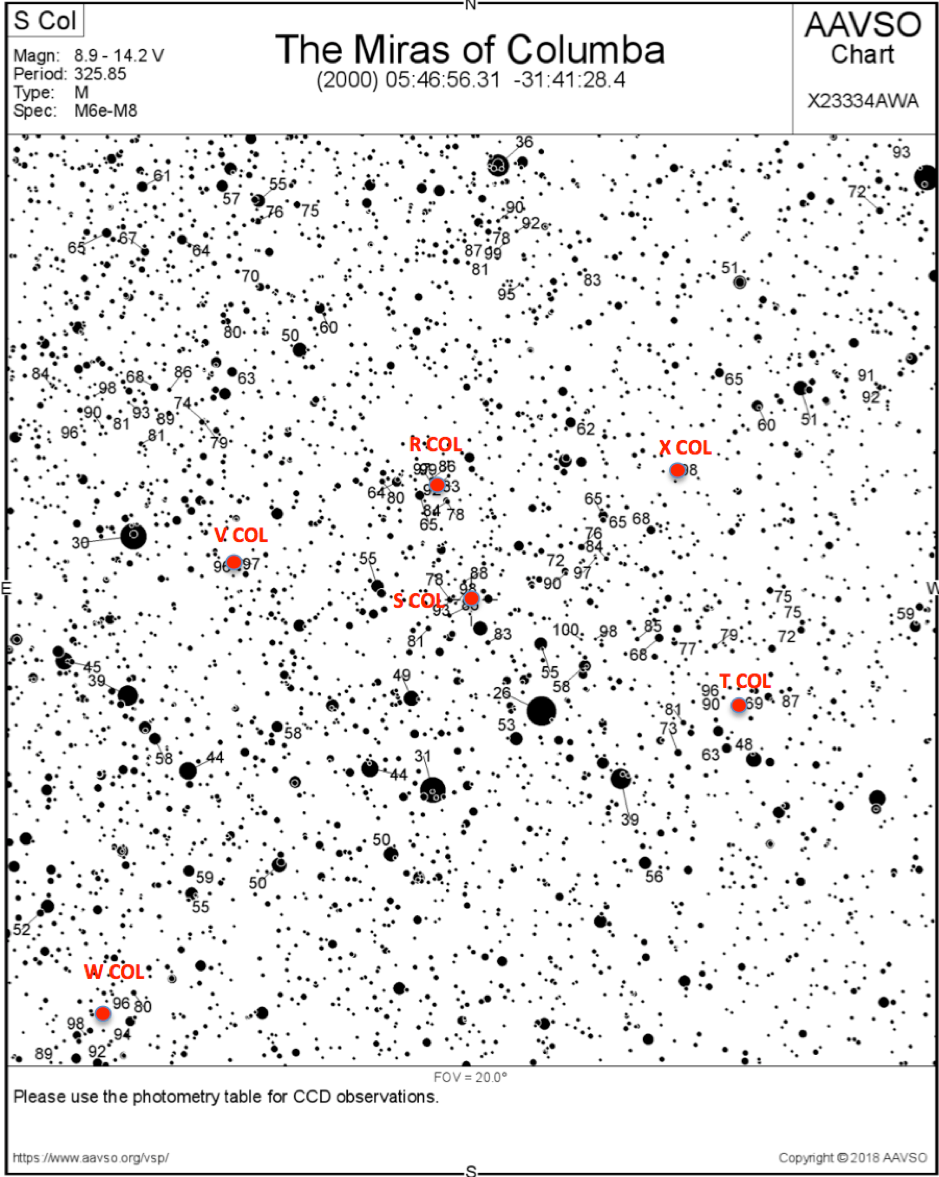
The Miras of Columba
This month we’ll consider a group of Miras from a single constellation. For many visual observers, it’s quite an efficient process to follow LPV’s by constellation as it is relatively straightforward to star hop the short distances required.
This month we’ll focus on a group of Miras in the southern constellation, Columba. It’s actually not too far south and can be readily observed by northern hemisphere observers with good southern horizons! As a visual observer, the 6 Miras I follow in Columba, are very conveniently placed and easy to find and follow.
The chart below is wide field area of Columba and southern Lepus that shows the locations for R, S, T, V, W and X Columbae.
We’ll go through the relevant details of each. It’s interesting to note that they all are quite well behaved Miras which will be highlighted below.
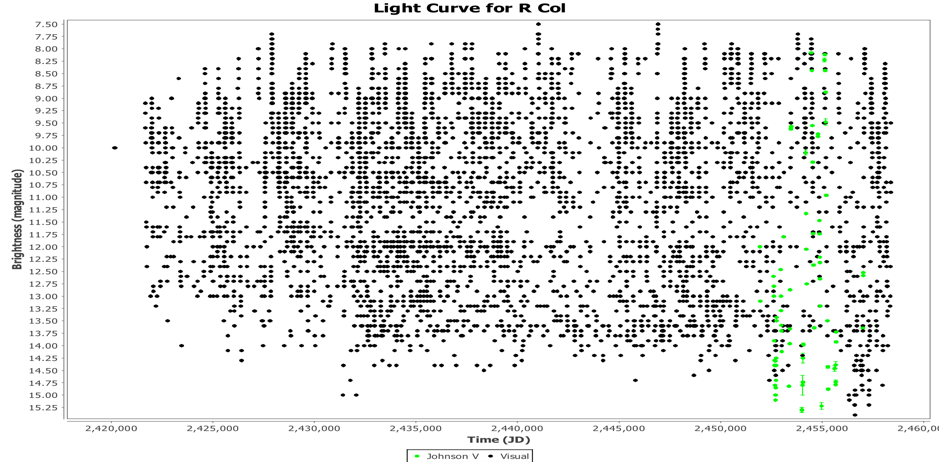
Let’s start with R Columbae. It has an observational history dating back to 1913 or just after the formation of the AAVSO with over 6,000 observations. The graph below shows all the observations in the AID. The GCVS lists R Col varying in brightness between 7.8 and 15.0V with a period of 327.62 days and a spectral class of M3e-M7. A period analysis of all AAVSO observations determined a mean period of 327.83 days. The analysis also shows 1st and 2nd harmonics in the signal that may indicate some non-sinusoidal features of the overall light curve.
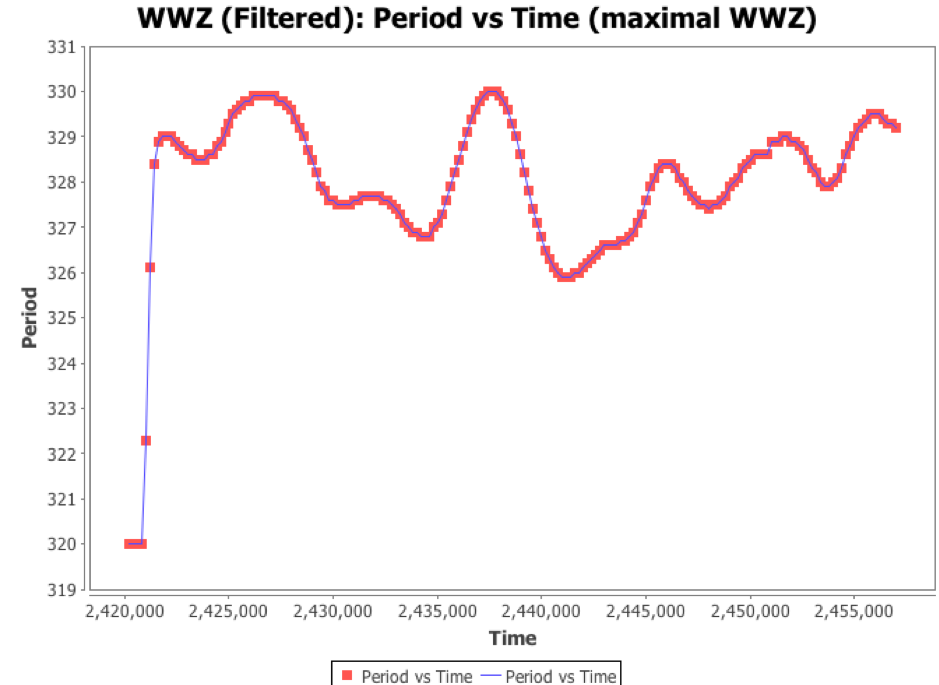
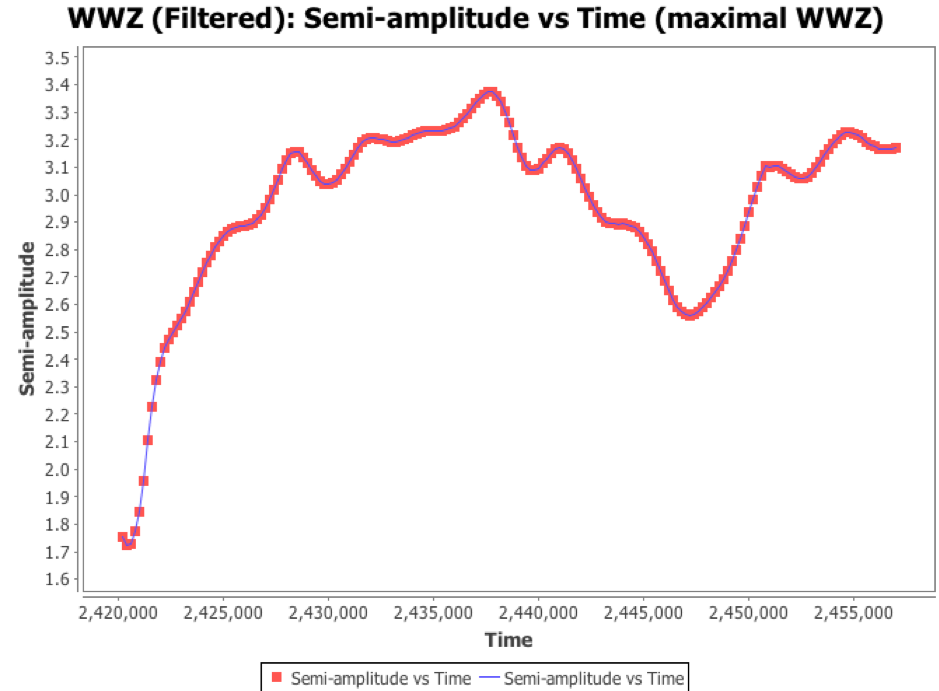
A WWZ analysis indicates that the mean period has remained remarkably stable over the last 100 or so years varying only between 326 and 330 days. There does appear to be some variation in the amplitude as shown in the figures below.
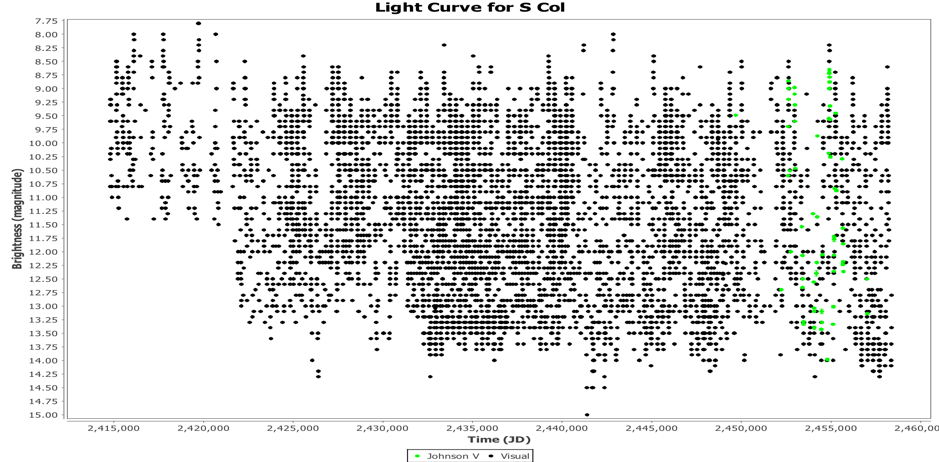
Only 2 degrees south of R Col, we come to S Columbae. S Col has over 7,500 observations in the AID with observations commencing way back in 1898 as shown in the figure below. S Col is included in the Legacy South group of LPV’s. The GCVS lists the brightness of S Col varying between 8.9 and 14.2 V with a mean period of 325.85 days and a spectral class of M6e-M8. A period analysis using the AAVSO data has determined a mean period of 325.79 days which is very close to the GCVS value. The first harmonic is visible in the signal that may indicate some departure from a standard sinusoidal behaviour of the light curve.
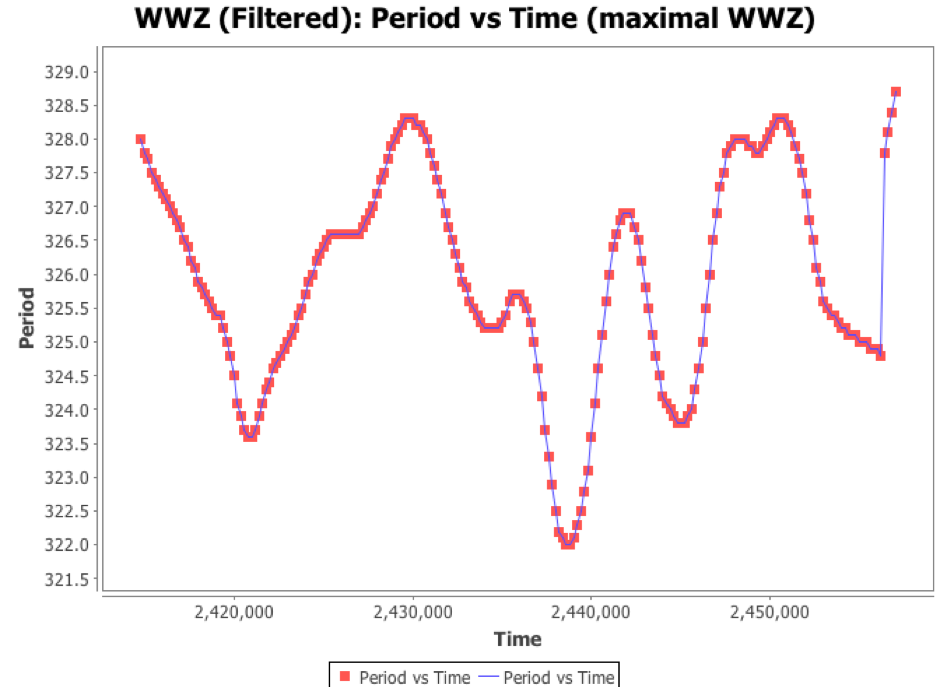
A WWZ analysis indicates a slow meandering of the mean period between 322 and 328 days which is typical of many LPV’s.
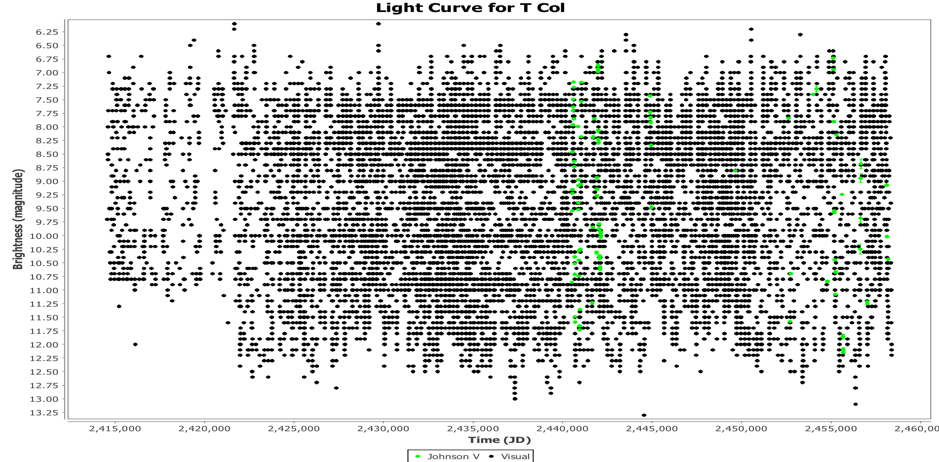
Approximately 8 degrees WSW of S Columbae, we come to T Columbae. T Col is the most widely observed Mira in Columba with nearly 12,000 observations in the AID dating back to 1898 as shown in the figure below. T Col is included in the Legacy South group of LPV’s. The GCVS lists T Col as varying between 6.6 and 12.7 V with a mean period of 225.84 days which is relatively short for a Mira with a reasonable amplitude range. The spectral class is listed as M3e-M6e. A period analysis based on AAVSO data determines a mean period of 226.12 days which is very close to the GCVS value. No harmonics are readily evident in signal indicating that the light curve displays quite a regular sinusoidal shape.
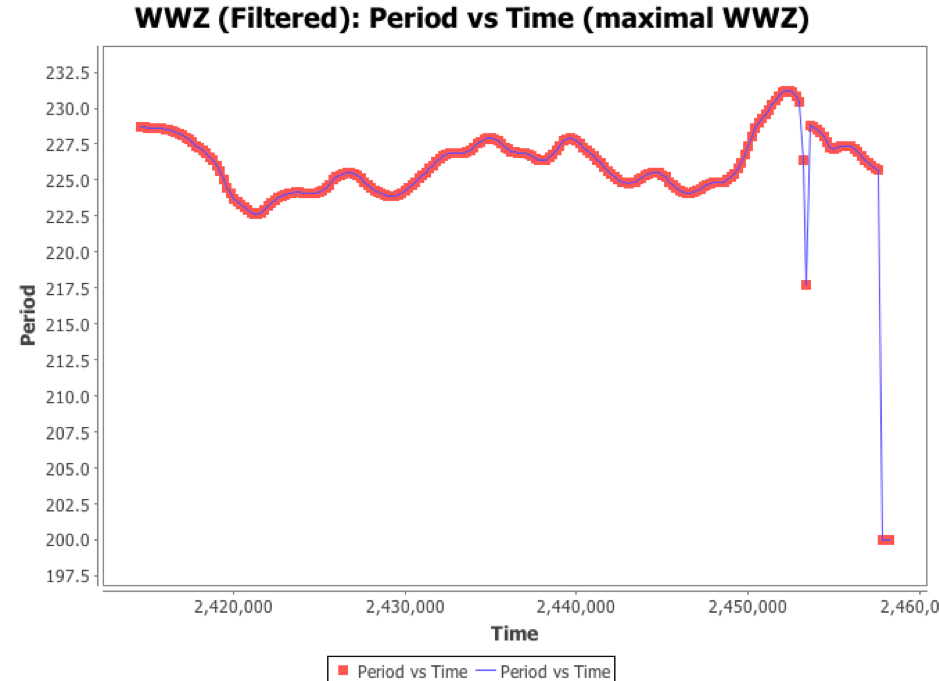
A WWZ analysis again shows only a very slow meander in mean period between 222 and 230 days. Nelson (1994) analysed RASNZ VSS observations for T Col between 1944 and 1992 and concluded that there appeared to have been an apparent decrease in the period from 226.91 to 224.24 days in this interval. That is also evident in the WWZ analysis shown below. However, it can be seen that since 1992, there was a peak in period of nearly 230 days around 2002 before a decrease to a present day value of approximately 225 days.
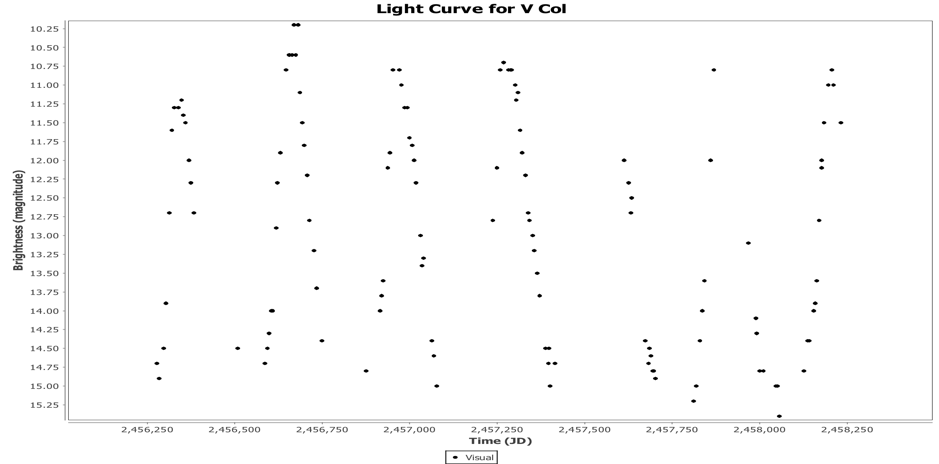
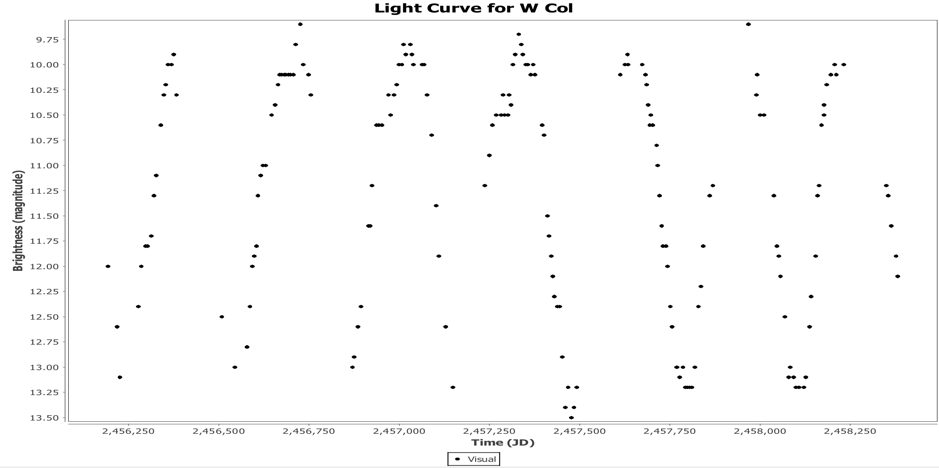
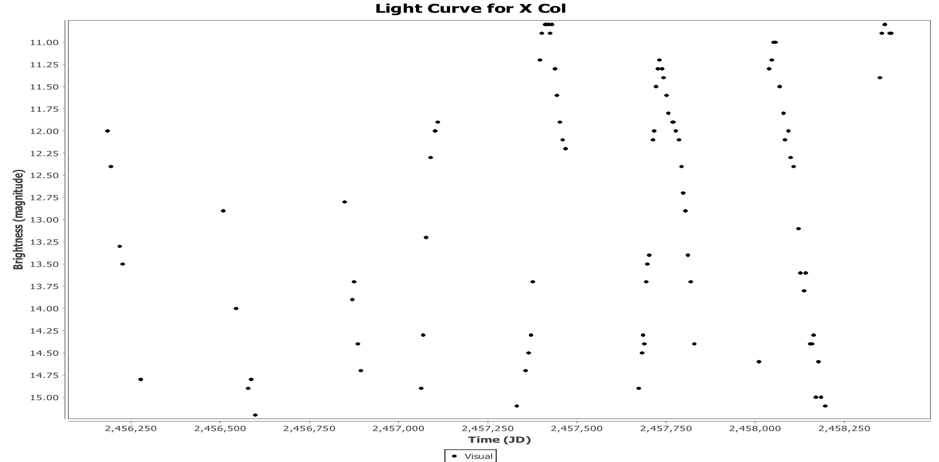
The remaining 3 Miras (V, W and X Col) that we’ll look at have been less well observed than the first 3 with observational histories only dating back for the last 10 or so years. Their light curves are shown below. All are reasonably bright at maximum so we would urge any observers who do monitor R, S or T Col, add these 3 to your list when you’re in the area!
The GCVS lists V Col with a mean period of 300 days and magnitude range of 10.4 to < 15.0 with spectral class of Me. A period analysis of the short observational arc in the AID indicates a mean period of 309.34 days with the 1st and 2nd harmonic evident in the signal. The observations indicate that the minimum magnitude for V Col probably gets down to 15-16th magnitude.
The GCVS lists W Col with a mean period of 327 days and magnitude range of 9.3 to < 11.5 with spectral class of M6e. A period analysis of the observations in the AID indicates a mean period of 310.25 days. The observations indicate that the minimum magnitude for W Col is approximately 13.5.
The GCVS lists X Col with a mean period of 321.9 days and magnitude range of 11 to < 13 with spectral class not identified. A period analysis of the observations in the AID indicates a mean period of 316.56 days with the 1st and 2nd harmonic evident in the signal. The observations indicate that the minimum magnitude for X Col probably gets down to 15-16th magnitude.
We would encourage all observers who can readily access Columba to follow these Miras which are very well suited to visual observing.
References
"The MIRA Variable – T Columbae” P. Nelson, Publications of RASNZ VSS, No. 19, 1994