

JULY 2017
T Cassiopeiae
T Cas is a bright Mira that has been well observed by the AAVSO since 1870 with over 54,000 observations in the AID from over 1,500 different observers. The light curve shown below displays all observations in the AID. It is one of the Legacy LPV Program stars.

The light curve based on the last 2,000 days is shown below.

The light curve based on the last 1,000 days is shown below.

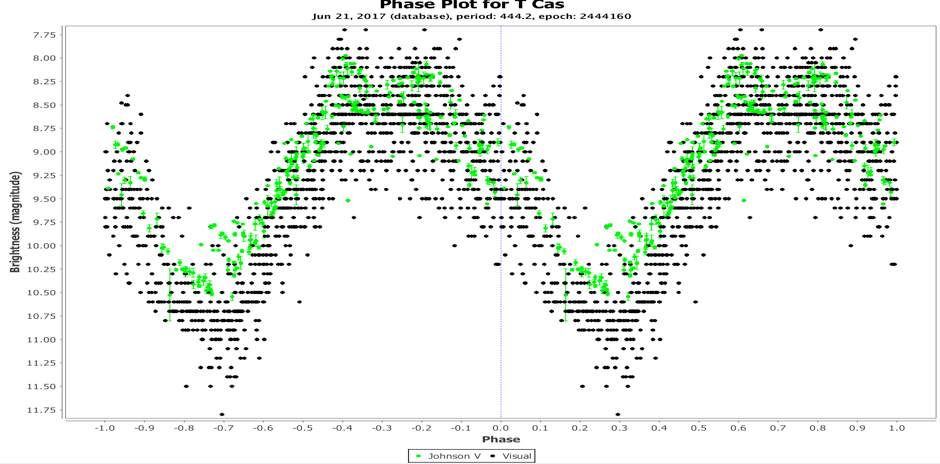
Its spectral class is M6e to M9e according to the VSX and is classified as a Mira. The GCVS lists T Cas as having a visual magnitude range of 6.9 to 13.0 with a period of 440 days. Analysis of all AID data in the period 1870 to the present day indicates an overall mean period of 444.2 days. The analysis also clearly shows smaller harmonics in addition to the 444 day fundamental period. These occur at periods of 222 and 148 days which were also found in the analysis performed by Howarth (1997).
It displays an asymmetric light curve with an F value of 0.44 (where F is the fraction of the period that maxima occur after the previous minima).
The light curves seem to show a pronounced double peak or maximum in a number of cycles. This can be seen in the phase plots shown below. However recently observed double maxima are more clearly shown when considering the CCD observations. Howarth (1997) also reported the presence of humps on the ascending branch of the light curve. Based on nearly 12,000 observations made by the BAA VSS in the period between 1920 until 1995, the hump was visible on many of the cycles and the double maximum was prominent in 1920-1921, 1939 and 1987-1988. This is confirmed in AAVSO data as well with another less well observed double maxima possibly occurring in 1945 and others in 1961 and 1978. Since 1995 there appear to have been further double maxima in 1995-1996, 2004-2005, 2007, 2008, 2011 and 2015.
A particularly pronounced double maximum, which was observed in 1939 is shown in the figure below.


Howarth (1997) analysed changes in the amplitude and phase of the fundamental periods and the harmonics and found that when the phase of the first harmonic retreats compared to the fundamental period, this shows up in the light curve as a double maximum feature. When the phase of the first harmonic advances compared to the fundamental period, this shows up in the light curve as the hump moving along the ascending branch away from a double maximum feature.
Howarth and Greaves (2001) surmised that the hump on the ascending branch of the light curve migrates with a cyclical period of approximately 3,000 days and that this variation is related to changes in phase of the first harmonic. The amplitude of the first harmonic and the phase difference between the primary period and first harmonic varies in a time frame of approximately 3,000 days. During this migration, at certain points, the hump manifests itself in the appearance of the double maximum.
Mathew Templeton’s poster paper on Miras with double maxima also contains an interesting discussion on possible causes.
Stan Walker from RASNZ VSS provided an interesting commentary that the vast majority of currently identified LPV’s which display the double maximum feature are located in the southern sky. Furthermore these are all located in a small region of the sky (1.7% of the total sky). T Cas currently appears to be the only other candidate located in the northern hemisphere. It would be a worthwhile project to look for other DMM stars outside of the currently identified group.
T Cas was one of the Miras studied by Lockwood and Wing (1971) in the near infrared. The IR light curve displayed the same general features as can be seen in the visual light curve including the humps on the ascending branch. They also found that the various features of the light curve seem to lag the visual features at the longer IR wavelengths. In the case of T Cas, this amounted to about a 10% of the period lag.
Only limited CCD photometry has been reported to the AID. B-V has been measured in the range of 1.5-2.0 throughout all phases of the light curve.
T Cas is also believed to be one of the nearest known AGB stars
An analysis has been performed to ascertain any period changes in T Cas over the past 140 years based on observations in the AAVSO AID. The figure below suggests that there has been a "meandering" of the mean period between the range of 439 to 449 days. This slow meandering behaviour (with period changes general less than 5% of the mean period) is relatively common in the longer period Miras and semi-regular stars.

T Cas is an interesting LPV to follow so all are encouraged to maintain the coverage that has been in place over the last 140 years.
References
"T Cassiopeiae – a predictable variable?", J. J Howarth JBAA, 107, 5, 1997
“Light curves of Mira Variables at 1.04 Microns”, G.W Lockwood & R.F Wing, The Astrophysical Journal, 169:63-86, 1971
“Amplitude and phase changes in the light curves of long period variables”, J.J Howarth & J. Greaves, MNRAS, 325, 1383-1388 (2001)
Templeton poster - https://www.aavso.org/files/publications/staff_pubs/templeton_mira_humps_bumps.pdf