V Canum Venaticorum (V CVn)
By Rich Roberts
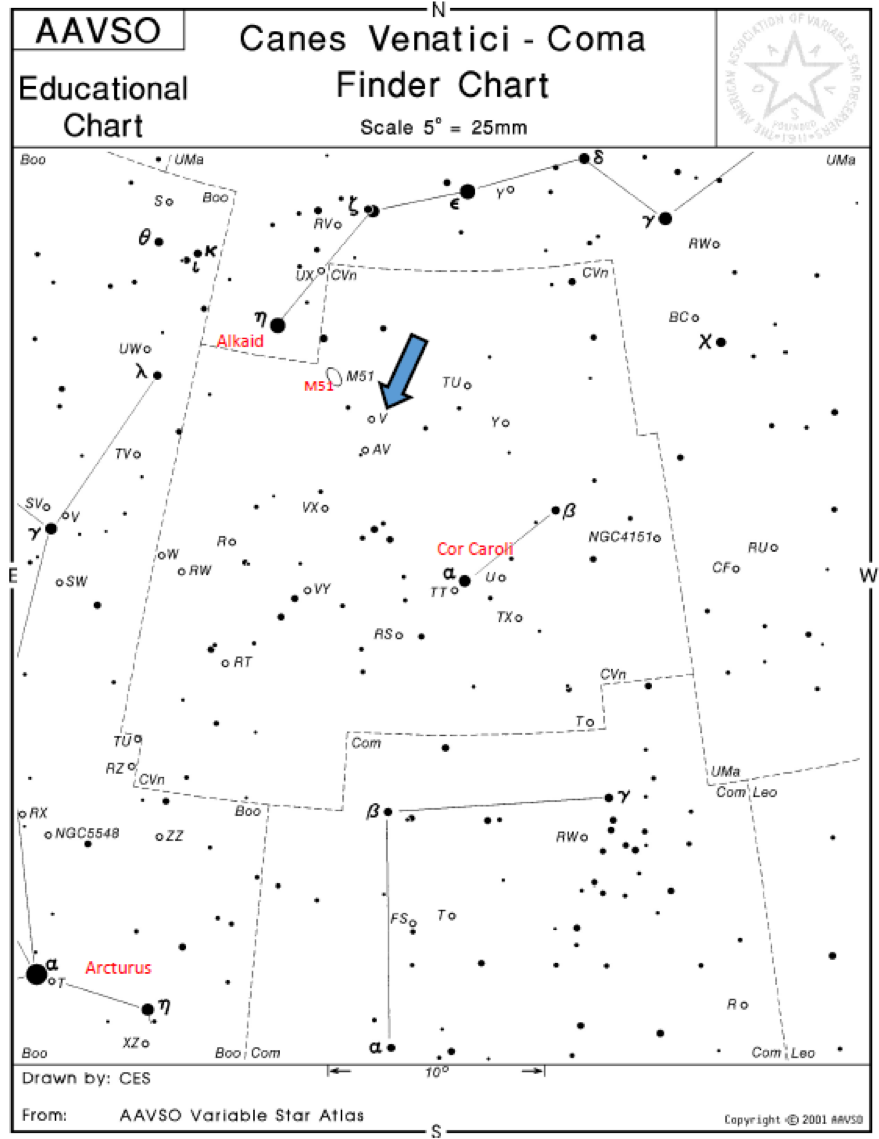
Although I spend most of my time at the eyepiece productively measuring variables, I do indulge in a few astronomical guilty pleasures. The Whirlpool Galaxy (M51) is one of those objects I just like to look at and enjoy. Springtime diversions to Whirlpool Galaxy can be justified, however, because approximately 3 degrees to the southwest of M51 is a very interesting long period variable, V Canum Venaticorum. So, I’m not really time-wasting. I’m just taking the scenic route while accomplishing my ultimate observing session goals. At least that’s what I tell myself.
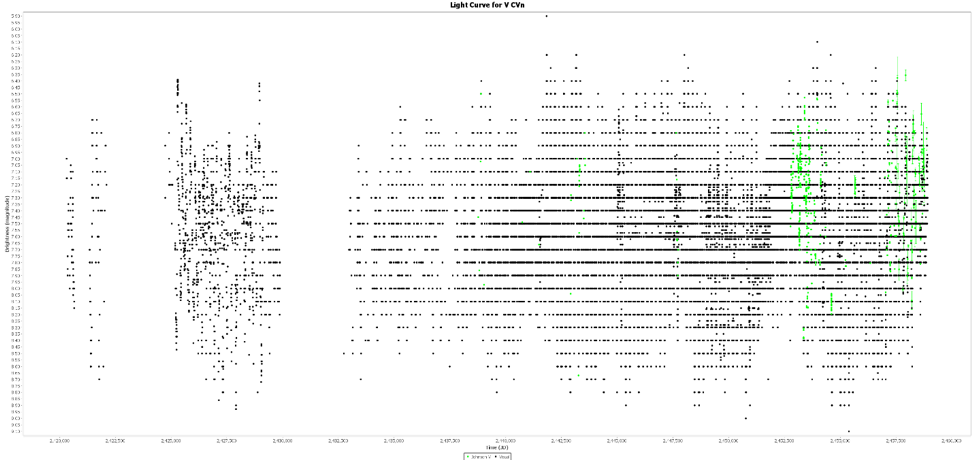
V CVn is classified as an SRa (semi-regular pulsating red variable). SRa classified stars are primarily separated from Miras by amplitude. A pulsating red giant must have a magnitude difference greater than 2.5 in V to be considered a Mira (Mattei et al., 1997). Semi-regular (SR) variables have smaller amplitudes, no shock waves, and little to no mass-loss; however, the difference between Miras and SRs is complicated, and may depend on several other factors (Percy 2007). Semi-regular variables also don’t have the cycle to cycle consistency of a Mira, which can be seen in the light curve below of the last 2,500 days of visual observations.

 V CVn is included in four different AAVSO campaigns, which can be queried in VSX, the binocular campaign, the LPV program, the LPV legacy program, and Percy’s list of unusual stars, so it is not surprising that this is a very well-observed star. Currently, there are 44,815 observations in the AID, 42,902 (95.7%) of which are visual. The only consistent multi-band photometry was carried out by Dale Mais (MVD) from December 2004 to March 2007. The first observation was recorded in June of 1914. The top three observers of V CVn are Frederick West (WEF), who recorded 2,137 observations between 1981 and 2007; John Toone (TOO), who recorded 1,739 observations between 1977 to the present; and Edward Oravec (OV), who recorded 1,400 observations between 1950 and 2002. A total of eight different observers have logged over 1,000 observations for this star.
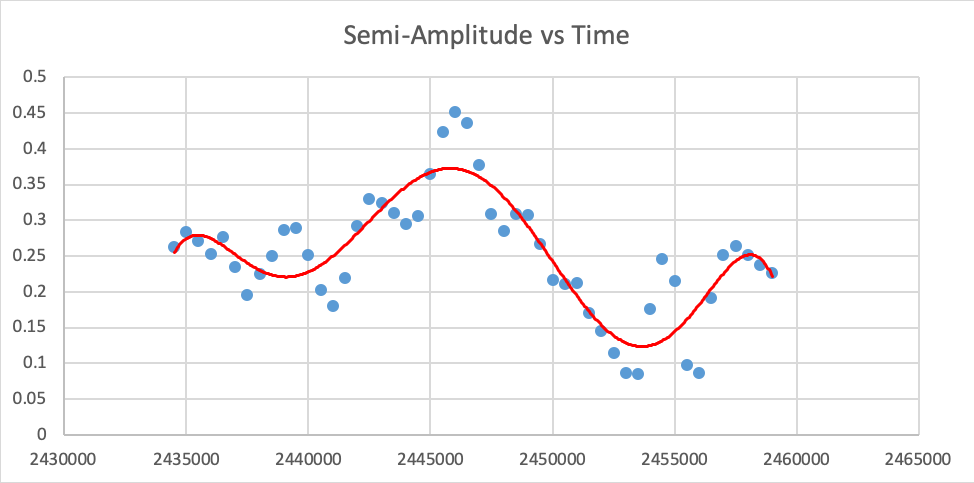
The reason V CVn finds itself on Dr. Percy’s list of “Pulsating Red Giants Showing Interesting and/or Unusual Behavior” is the star’s recent amplitude changes. The decrease in amplitude is apparent when looking at the 2,500-day visual light curve posted above. The amplitude appears to be somewhat cyclical when visually inspecting the light curve with all the available data loaded in VStar.
 I charted out 67 years’ worth of semi-amplitude data exported from VStar into Excel to better see the trend.
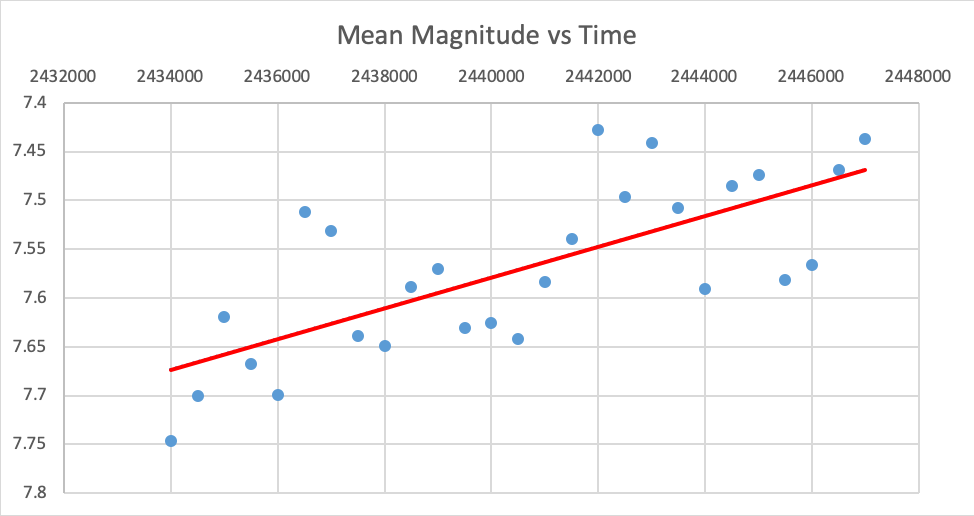
The mean magnitude of the stars seems to be brightening over time. Below is 67 years’ worth of mean magnitude data plotted vs. time.
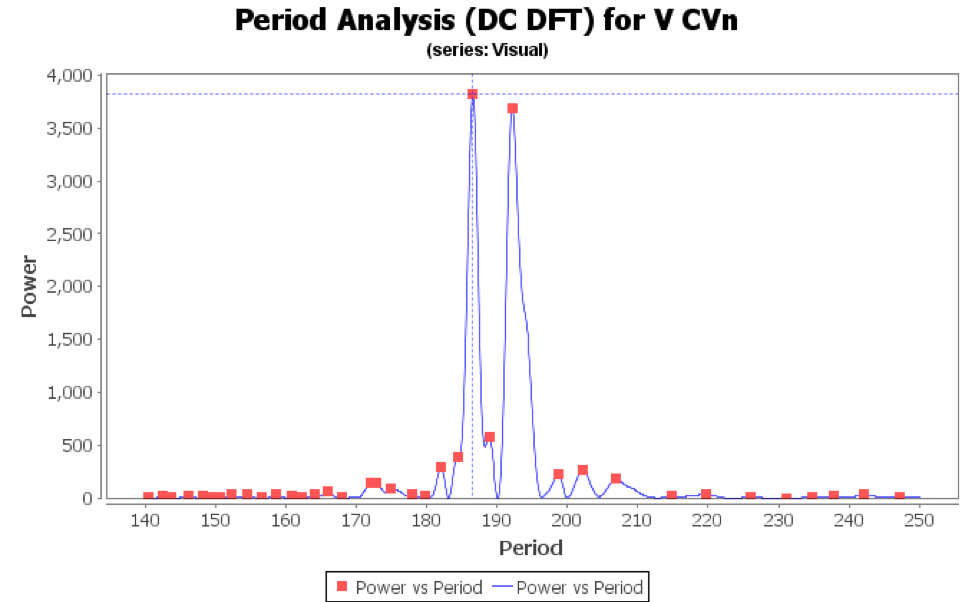
 Although the amplitude and mean magnitude seem to vary over time, the period has been fairly consistent. VSX lists the period as 191.86 days, which is consistent with the period commonly cited in literature. Kiss et al. (2000) found evidence of multi-periodicity in V CVn, and reported periods of 186 and 194 days based on analysis of 37 years’ worth of AAVSO data. The small period ratio (1.04 in V CVn’s case) suggests either a high-order overtone or radial + non-radial oscillation. Buchler et al. (2004) argues that the multi-periodic frequency peaks in the Fourier Spectra are likely not real due to physical limitations, and may be evidence of multi-dimensional chaos. I found similar periods to Kiss when analyzing 67 years’ worth of data in VStar, with the strongest hits at 186.5 and 192.1 days.
 Below is a phase plot from ASAS-SN for the past 1,000 days of data and a period of 194.76 days.

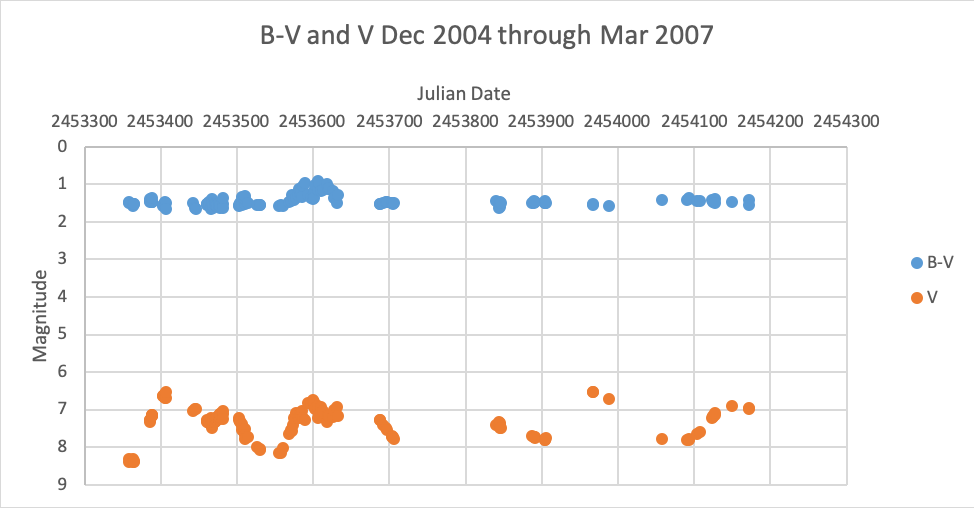
I plotted V against B-V for the approximately three-year period in which good multi-band photometry was available in the AID. B-V remains very steady during this time period, suggesting the effective temperature of the star did not change much over this period of time. The average B-V over this period of time was 1.45, making this a fairly reddish orange star and consistent with its spectral class (M4e-M6e). Wasatonic & Guinan (1998) studied this star using Wing near IR and found the spectra is dominated by strong TiO bands. They also found the Teff of this star is around 3,200K at maximum and 2,200K at minimum.
 Another unusual quirk of V CVn is the star’s polarization. Mira and Semi-regular stars are known to be polarmetrically variable; however, V CVn has an usually large and unexplained amount of polarization, which ranges from 1 to 6%. Maximum polarization happens at minimum brightness and vice versa. The only other known LPV with this magnitude of polarization is L2 PUP. Most other LPVs will have less than 1% of polarization. The other strange aspect of V CVn’s polarization is that Neilson et al. (2014) found the position angle of the polarization to have been constant for the past 40 years. The cause of this is debated, but it does allow us to probe the space between the stellar atmosphere and the circumstellar atmosphere. Nielsen et al. (2014) examines several of the possible explanations, and concludes that the most likely source of the polarization and constant position angle is due to a bow shock and Mira tail. This conclusion cannot be proved due to the star’s distance (1.17 +/- 0.23 Kpc per Gaia), which does not allow for the spatial resolution needed to see the tail. Safonov (2019) also examined the different possibilities (including the bow shock scenario) and concludes the star is most likely surrounded by a reflection nebula.
V CVn should continue to be observed by AAVSO members. The star is easily accessible to small scopes and binoculars. The star is easy to identify due to its orange color and sparse star field. The star can be properly estimated when near maximum with a 1 degree FOV chart with two available 8th magnitude comps to the northwest. At maximum light, you’ll need a 2.5 degree chart to bring in the 5.9 comp. Visual observations will be needed to monitor the amplitude change and to determine if a period change may occur sometime in the future. Additional multi-band photometry would be a welcome addition to the AID since only 3 years of good data currently exists.