

February 17, 2021
AAVSO Forum threads (scroll to the bottom of a thread for latest posts):
- Campaigns and Observation Reports: https://www.aavso.org/ss-cyg-hq-campaign
- Spectroscopy: https://www.aavso.org/ss-cyg-hq-campaign-01
Please subscribe to these threads if you are participating in the campaign so you can be updated by HQ. Join in the discussion or ask questions there!
The AAVSO requests spectroscopy and photometry of the UGSS-type cataclysmic variable SS Cyg, which has been and is continuing to exhibit highly atypical behavior.
Both high-resolution (R~10,000) and low-resolution (R~1000) spectroscopic observations are requested, as are multi-color photometry and visual observations. Coverage is requested to continue until SS Cyg has resumed its normal behavior.
SS Cyg typically has outbursts roughly every 40-60 days, although the interval can vary quite a lot. Its typical outbursts may be narrow (fast rise to maximum and fast decline), wide (fast rise and slow decline), or anomalous (slow rise and slow decline) (Figure 1). It frequently reaches magnitude V~8.2 at maximum, and is usually V~11.8-12.2 at minimum.
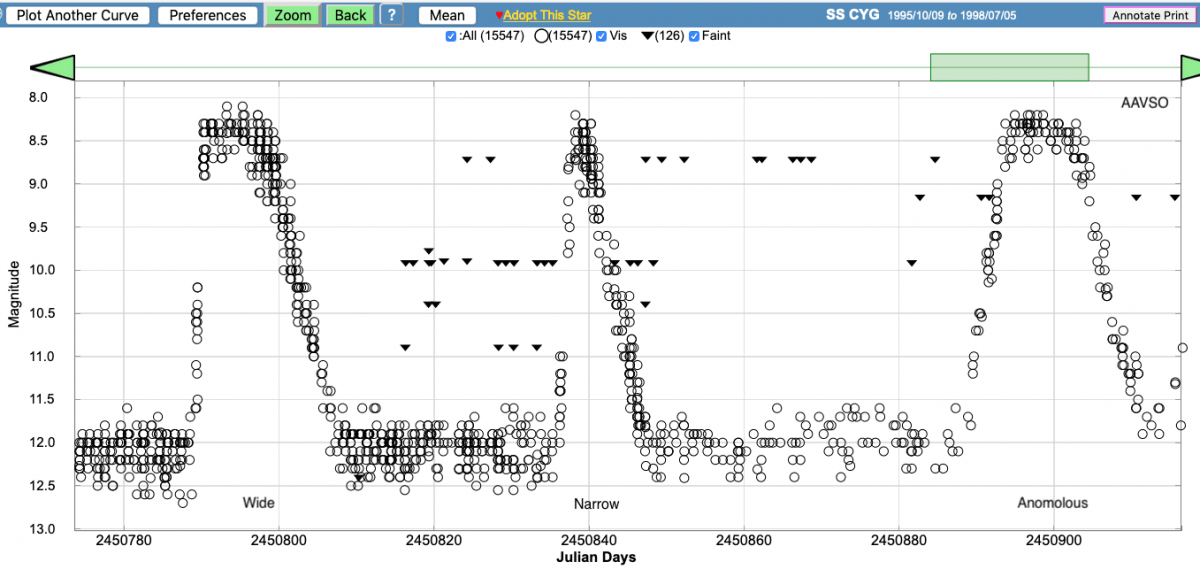
Figure 1. Typical outbursts of SS Cyg: wide, narrow, anomalous.
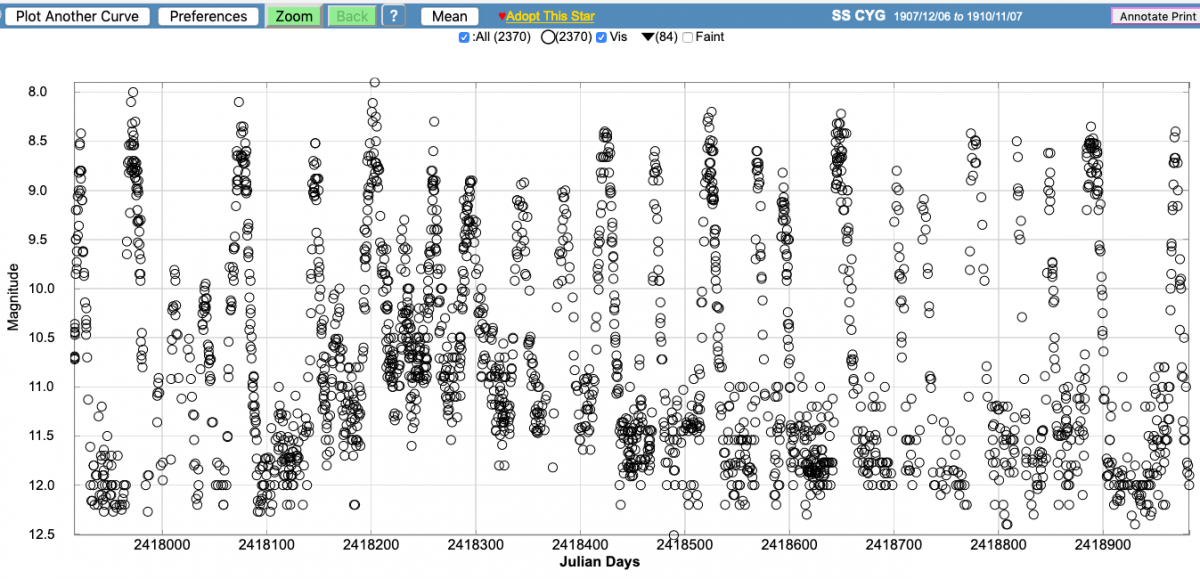
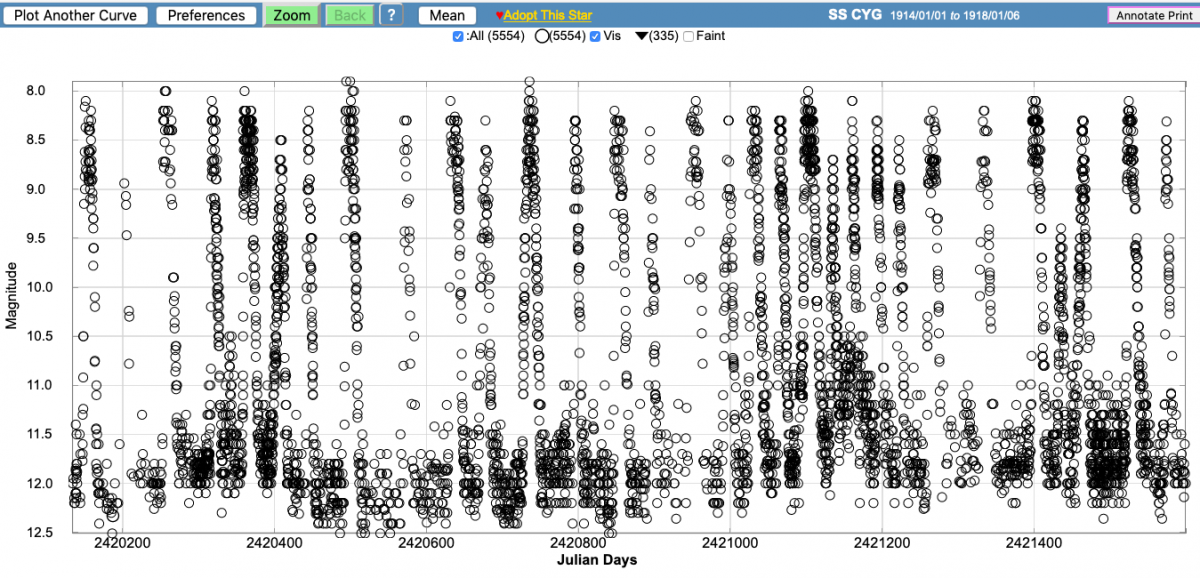
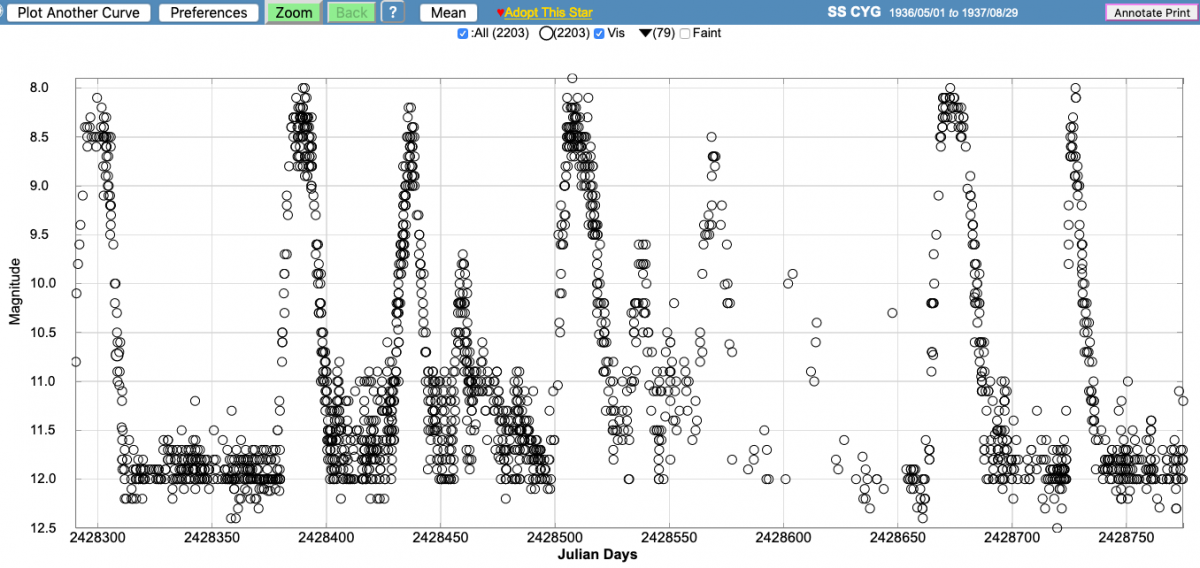
Over the decades, SS Cyg has shown periods of atypical behavior, for example, in 1907-1910 (Figure 2a), 1914-1918 (Figure 2b), 1936-1937 (Figure 2c), and 1958-1960 (Figure 2d).
2a - 1907-1910
2b - 1914-1918
2c - 1936-1937
2d - 1958-1960
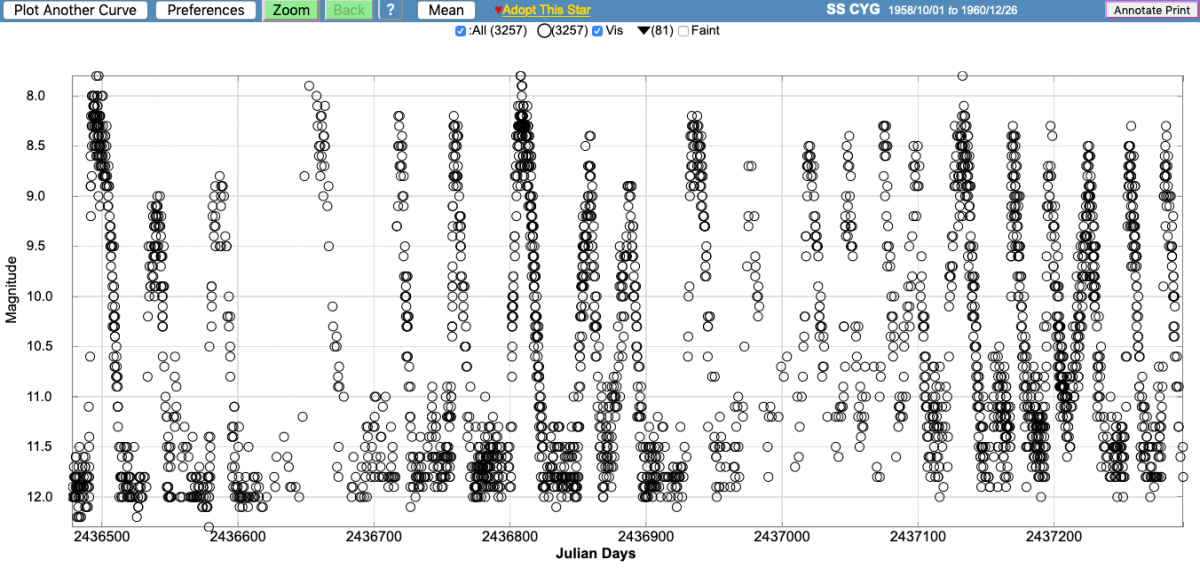
Figures 2a-d. Some intervals of atypical behavior in SS Cyg. In these light curves fainter-thans have been omitted for easier viewing.
The current episode began in October 2019 (Figure 3).
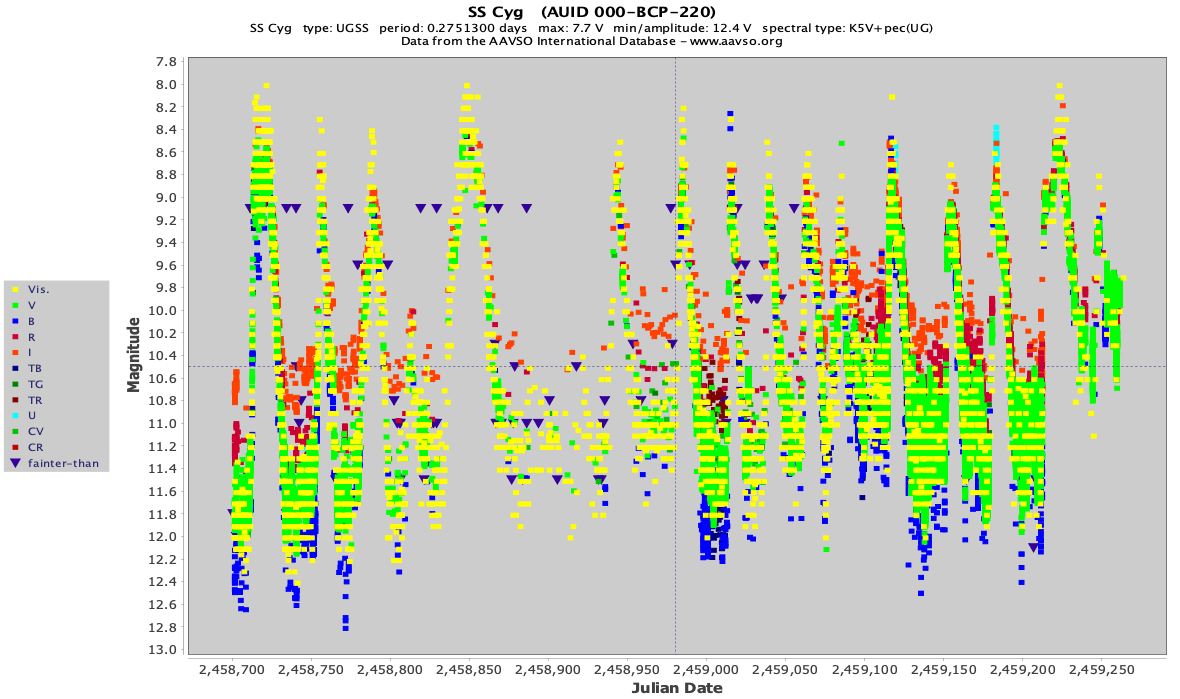
Figure 3. SS Cyg light curve August 2019 to February 2021, showing onset of atypical behavior in October 2019.
The complete light curve of SS Cyg since its discovery in 1896 is available in the AAVSO International Database. Over 1,000 observers worldwide have contributed data to the AAVSO on this prototype of its class of cataclysmic variable. The more than 688,000 observations are too many to display all at once in the AAVSO Light Curve Generator, so it is recommended to plot not more than 500 days at a time after JD 2450000. If you receive an error message when plotting, select a smaller interval.
The light curve of 1-day means of visual data from 1896 to 2010 is shown in Figure 4.
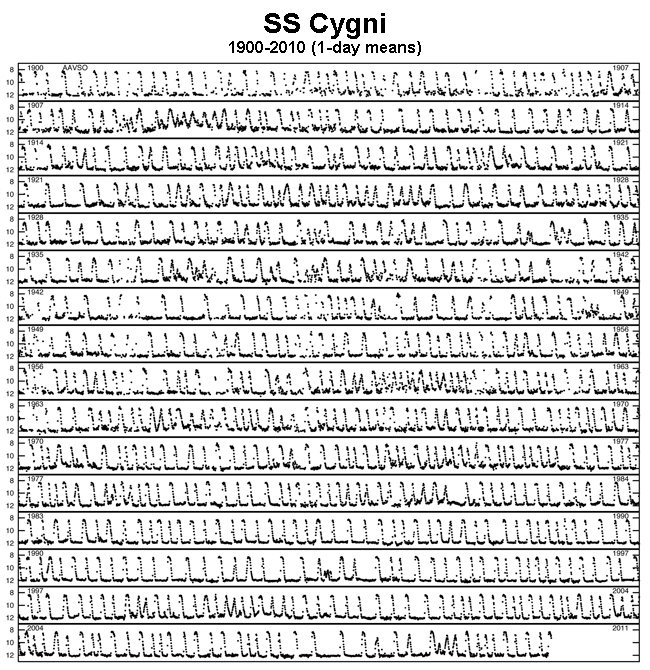
Figure 4. 1-day means of visual data of SS Cyg, 1896-2010, from the AAVSO International Database.
The light curve of AAVSO visual observations from 2010 to the present is shown in Figure 5. Non-visual observations are not included in order to make the light curve more easily comparable to the historical light curve in Figure 4.
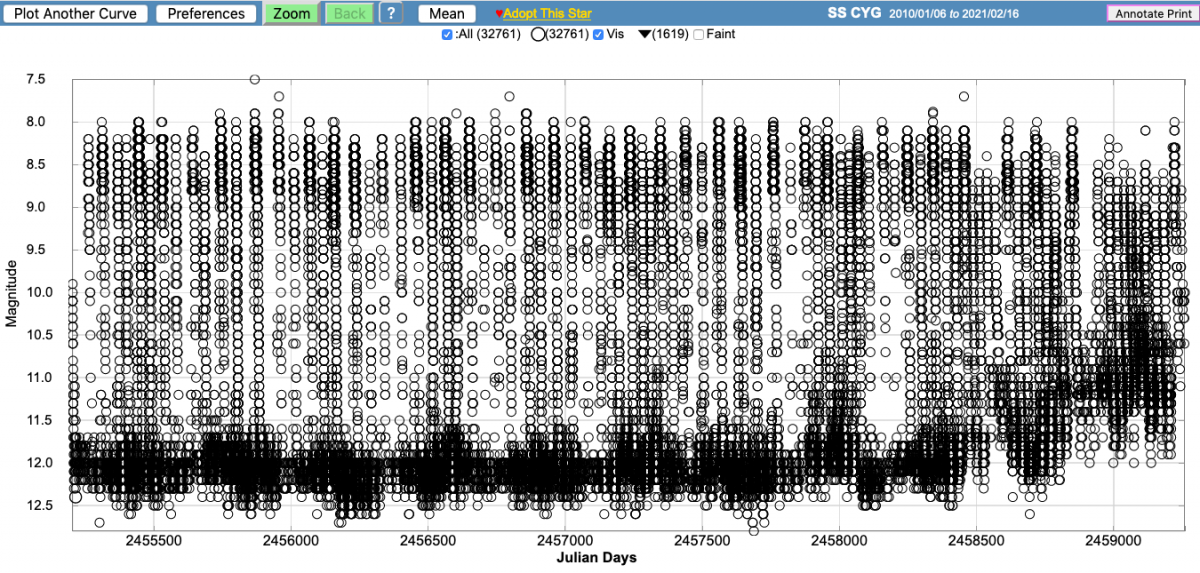
Figure 5. SS Cyg visual observations 2010-February 2021, from the AAVSO International Database.
Coordinates (2000.0): 21 42 42.80 +43 35 09.9 (from VSX page for SS Cyg)
Finder charts with comparison stars may be created using the AAVSO Variable Star Plotter (VSP).
Please submit observations using the name SS CYG as follows:
- Photometry: Use WebObs to submit to the AAVSO International Database
- Spectroscopy: Submit to the AAVSO Spectroscopic Database (AVSpec)
This AAVSO Alert Notice was compiled by Elizabeth O. Waagen.
------------------------------------------------
SUBMIT OBSERVATIONS TO THE AAVSO
Information on submitting Optical and Spectroscopic observations to the AAVSO may be found at:
https://www.aavso.org/webobs
ALERT NOTICE ARCHIVE AND SUBSCRIPTION INFORMATION
An Alert Notice archive is available at the following URL:
https://www.aavso.org/aavso-alert-notices-for-observing-campaigns-and-discoveries
Subscribing and Unsubscribing may be done at the following URL:
https://www.aavso.org/aavso-alert-notice-subscribe
-------------------------------------------------
Please support the AAVSO and its mission -- Join or donate today:
https://www.aavso.org/apps/donate/