I purchased an Alpy-600 6 years ago. At that time I was busy with differential photometry so
didn’t spend the time necessary to learn “do” spectroscopy.
The years are getting ahead of me, and now with the AAVSO spectrum archive I am determined
to do spectroscopy science.
I have had some success in posting spectra but most of my attempts have been rejected. My
presentation of “A” type stars just does not fit the “mold”
Here is my setup:
30cm standard f/5 Newtonian
Alpy600
Canon EOS 450 with filter modifications
Here is the procedure:
Nebulocity -- acquire images, raw-fit
AIP4Win -- to stack raw images then
-- do a 2x2 bin and then
-- do a noise filter
Rspec -- to extract spectra and do
-- Instrument-Response calibration.
– Save spectra data as 1d.
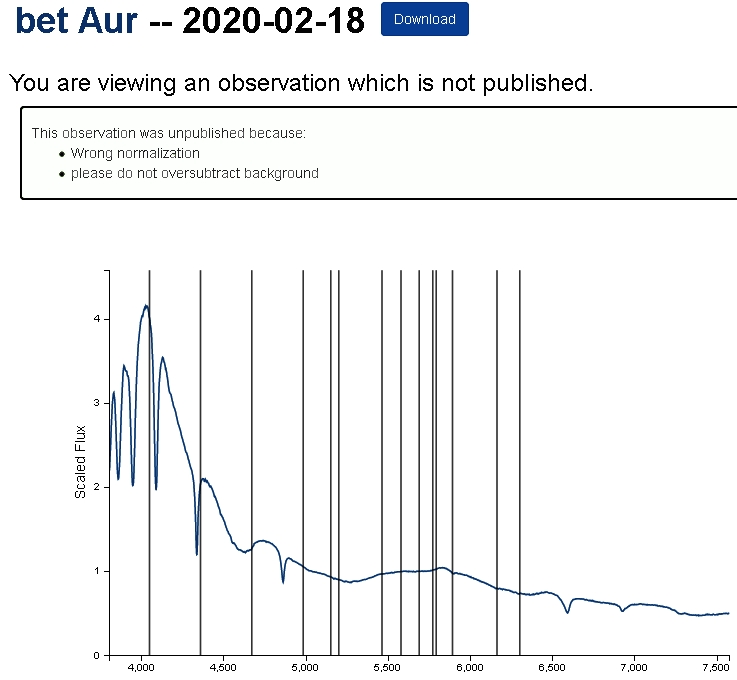
I have not been able to get a proper “A” type star spectra: see the image and comment. I have
constructed the IR calibration over and over using A and K stars, they both look the same and
seem to work on all Types except “A”.
At this point I suspect there is something going wrong in the method of getting the data out of the
Canon DSLR chip matrix ???
Any help, suggestions, guesses, would be useful.
Joe Garlitz
Elgin, OR


Hi Joe,
I dont understand the comments either. Your spectrum is clearly calibrated in relative flux, not normalised (rectified) and the comment about over subtracting the background does not make sense to me. Perhaps the moderator of the database can provide you with a further explanation. (In the BAA we offer a one to one mentoring service for people submitting to our database, perhaps AAVSO offer something similar)
Having said that your continuum shape is roughly right for an A star but there are obvious broad waves in it that should not be there. A mono camera is highly recommended over a colour camera for serious scientific spectroscopy for many reasons and getting the instrument response right is much trickier with colour cameras. For example if the spectrum is narrow there may not be even coverage of the three colour pixels so the response changes depending where the spectrum lies over the pixels. Also the uneven response of the three colours means the response curve is wavy where the filters overlap and it can be difficult to remove this effect of the filters but still remove the features you want to remove like the Balmer lines in A stars. I suspect this is what has happened here (Note you should always use hot eg A stars for instrument response not eg K stars so there are fewer lines to remove)
The first test for a good instrument response is to apply it back to the observed reference star spectrum. The result should very closely match the library version. If it does not, look closely at why it does not before trying to apply it to other stars. My workshop presention " Low resolution slit spectroscopy" also runs through the steps to produce fully calibrated spectra here.
https://www.britastro.org/downloads/15701
Cheers
Robin
Hi Joe,
your graph is going up to 4, The screenshot is saying: wrong normalization!
but as far as i know: normalization fluxes, etc is from 0 to 1,
meaning from 0 to 100%
Search for: normalize flux 0 to 1 method
regards Bernhard
Yes but the spectrum is correctly scaled in relative flux and AAVSO clarified that they accept flux calibrated spectra when I queried this. It makes no sense to normalise some wide range low resolution spectra in any case eg how would you sensibly normalise the spectrum of Betelgeuse or a spectrum of a type Ia supernova?
It is true though that the test spectra when registering for the database are supposed to be normalised, ie the continuum should be removed and the residual scaled to 1 on average. (I have no idea why as it would be trivial for the moderators to normalise flux calibrated spectra if they so wished before verifying them)
My other workshop presentation "low resolution slitless spectroscopy"shows both these techniques. ie flux calibration and normalisation (rectification)
Robin
Here is an example of a flux calibrated spectrum and after normalisation.
Note that in practise it is tough (and often impossible) to normalise most low resolution spectra accurately because of blending of lines which makes the continuum difficult to identify with any degree of accuracy. The result often contains artifacts due to the normalisation. For this reason normalisation is in my view best avoided for low resolution spectra submitted to databases. The end user can always normalise spectra if they so wish in any case, they cannot however recover the information lost by normalisation or identify the potential artifacts generated
Robin
Seems that there is a lot of learning yet to be done to be familliar with this science.
Joe
Again, thanks for the previous comments and suggestions.
For what it is worth: After numerous attempts to get proper spectra from a “good” Instrument
Response curve; Success!!
It turns out that the Response curve necessary to calibrate DSLR images (binned 2x2) is a lot
more complex than that for CCD chip derived images.
That attached image shows the final IR product. I have tested this IR curve to calibrate B, A F, G
K, and M stars. All seems well. I took the average of a variety of curves made from “A” stars
and smoothed out only the finest ripples.
I would be interested to hear from anyone else who is using a DSLR for spectroscopy.
Joe Garlitz